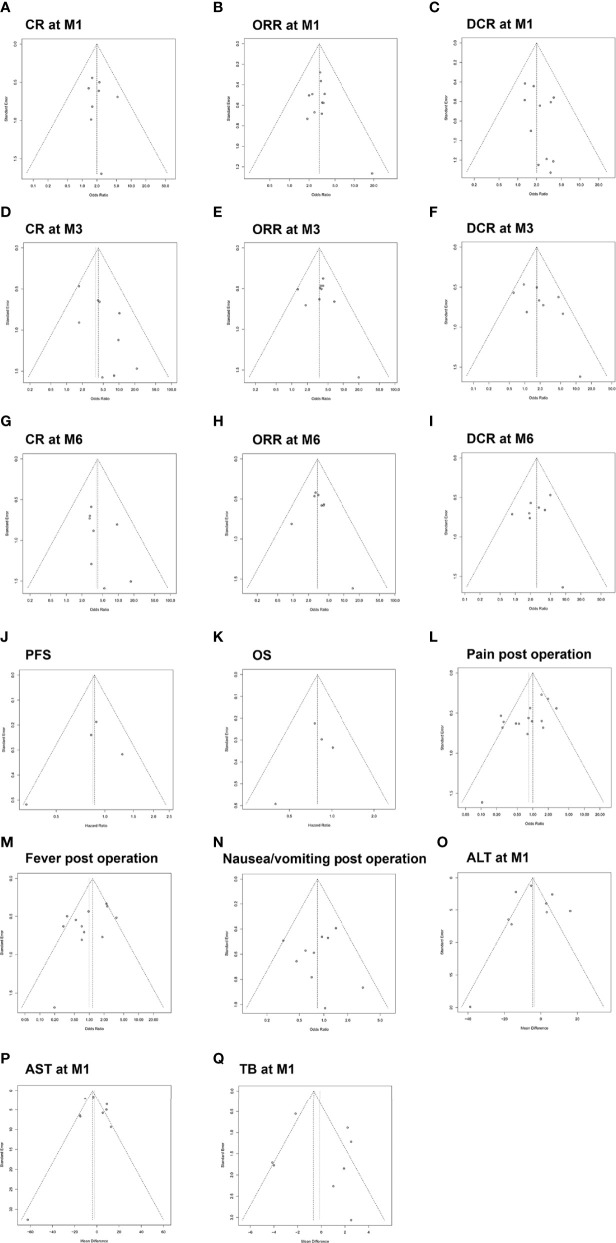
Figure 9.
Funnel plot for the publication bias test of included studies with regard to CR at M1 (A), ORR at M1 (B), DCR at M1 (C), CR at M3 (D), ORR at M3 (E), DCR at M3 (F), CR at M6 (G), ORR at M6 (H), DCR at M6 (I), PFS (J), OS (K), pain post operation (L), fever post operation (M), nausea/vomiting post operation (N), ALT at M1 (O), AST at M1 (P) and TB at M1 (Q). CR, complete response; ORR, objective response rate; DCR, disease control rate; M1, 1 month; M3, 3 months; M6, 6 months; ALT, alanine aminotransferase; AST, aspartate aminotransferase; TB, total bilirubin.

