Figure 3.
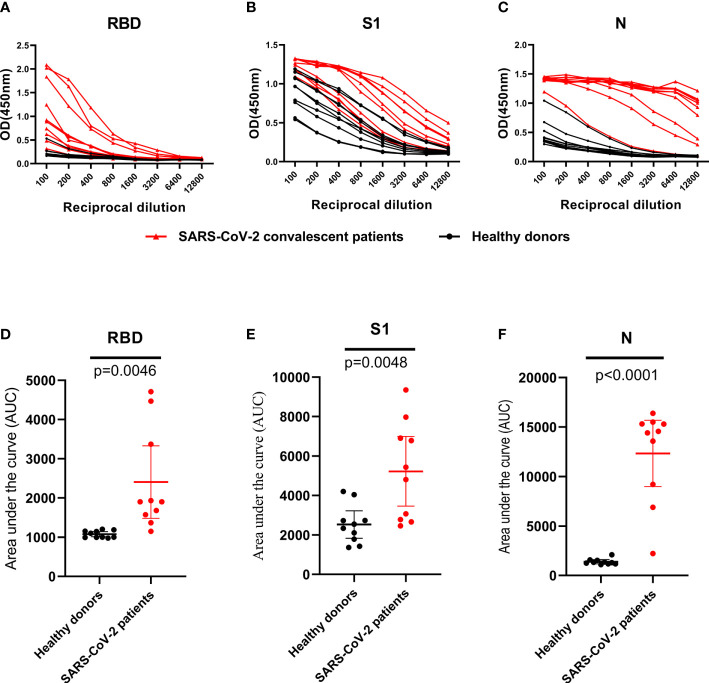
IgG antibodies response against RBD, S1 and N protein in control and SARS-CoV-2 convalescent plasma. (A–C), OD 450 values of IgG antibodies against RBD, S1 and N protein in randomly selected healthy donors (n=10; black dot and line) and SARS-CoV-2 convalescent plasma (n=10; black triangle and red line). (D–F), Data from the same samples in (A–C), respectively, but plotted by AUC mean with 95% CI. Statistical analyses were performed using corresponding unpaired two-tailed Student’s t test. Horizontal lines represent mean values.

