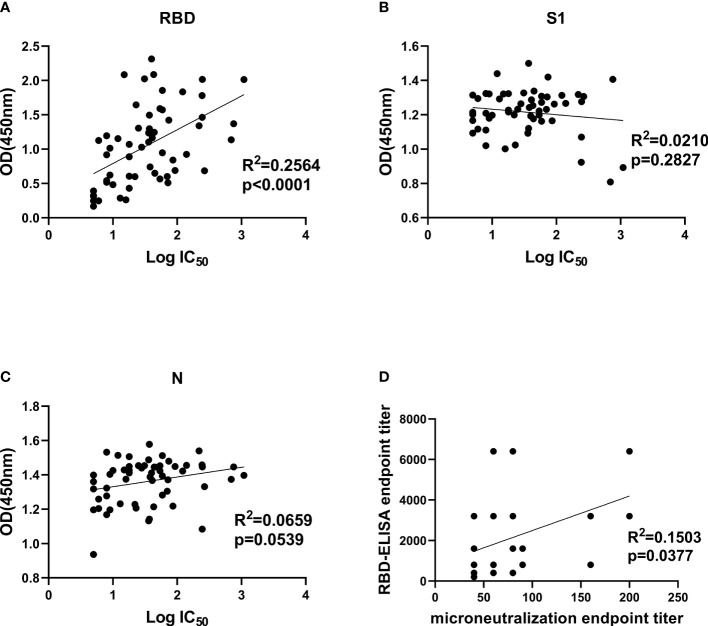
Figure 4.
Correlation analysis between IgG antibody levels and neutralization antibody titers. (A–C), Correlation analysis between neutralizing titers and RBD-, S1-, and N-specific IgG levels, respectively. Convalescent plasma collected from 57 COVID-19-recovered patients was used for SARS-CoV-2 pseudotype neutralization assay to test IC50 and indirect ELISA to test OD450 values at a fixed dilution (1:100). (D), correlation analysis between authentic SARS-CoV-2 neutralizing antibody titers and anti-RBD IgG levels in convalescent plasma. Statistics analysis was performed by using Graphpad prism 8.4 software. IC50, half-maximum inhibitory concentration.

