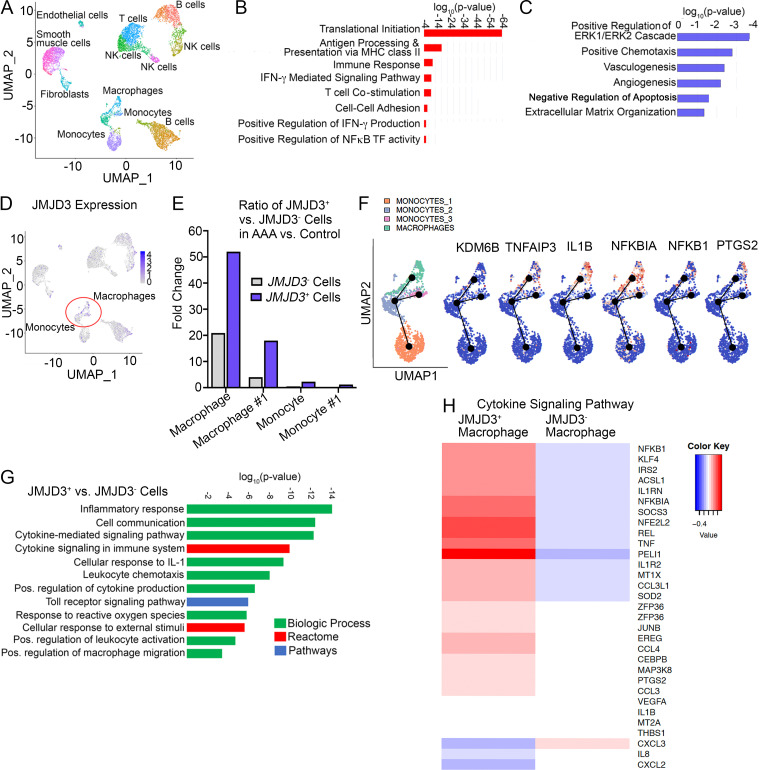
Figure 3.
Human aortic single-cell transcription profiling reveals elevated JMJD3 and inflammatory pathway expression in infiltrating monocytes/macrophages. (A) Cluster analysis using the uniform manifold approximation and projection technique of single-cell sequencing from human AAA (n = 4) and nonaneurysmal (n = 2) samples revealed 21 distinct cell clusters (representative). Source data are provided as a source data file. (B and C) Gene Ontology biological pathway enrichment analysis of differentially expressed genes up-regulated (B) and down-regulated (C) in AAA samples. The combined score metric corresponds to the P value (two-tailed Fisher’s exact test) multiplied by the Z-score of the deviation from the expected rank, and q values determined by Benjamini–Hochberg correction. (D) Feature plots displaying the single-cell gene expression of JMJD3 across cell clusters. (E) Fold expression analysis of JMJD3+ vs. JMJD3− macrophages or monocytes (clusters 1–3) in AAA versus control tissue. (F) Focused Monocle pseudotime trajectory analysis including only the monocyte/macrophage defined clusters. Monocyte/macrophage clusters superimposed on pseudotime branches with gene expression plotted as a function of pseudotime. (G) Gene Ontology biological process, Reactome, or process enrichment analysis of differentially expressed genes JMJD3+ versus JMJD3− cells. The combined score metric corresponds to the P value (two-tailed Fisher’s exact test) multiplied by the Z-score of the deviation from the expected rank, and q values were determined by Benjamini–Hochberg correction. (H) Heatmap of differentially expressed genes in JMJD3+ versus JMJD3− macrophages from the cytokine-mediated signaling pathway.

