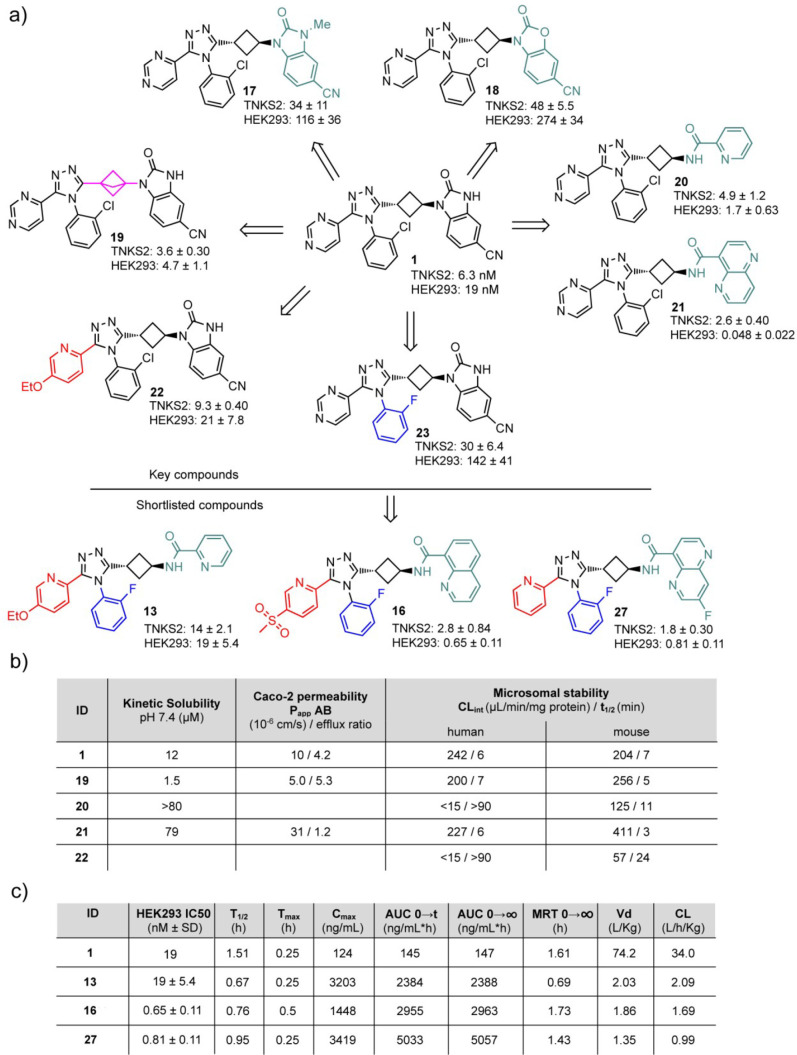
Figure 2.
(a) Selected key compounds in the optimization campaign and respective TNKS2 and HEK293 IC50 values. Mean ± SD values for three independent experiments are shown. Moieties are in color when differing from 1. (b) ADME data of key compounds. (c) Cellular efficacy and mouse po PK 5 mg/kg of the short-listed compounds.

