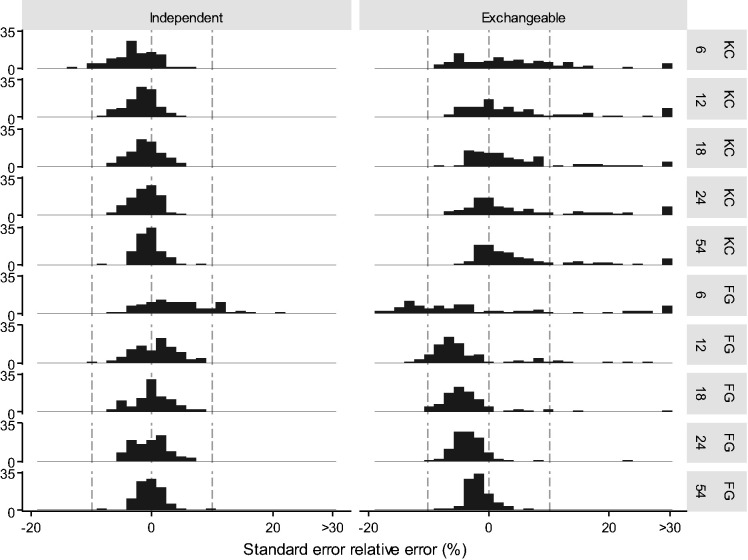
Figure 4.
Phase two: Histogram of relative error of sandwich standard errors with an independent or exchangeable working correlation matrix (columns) for Kauermann and Carroll (KC), and Fay and Graubard (FG) standard errors with either 6, 12, 18, 24, or 54 clusters (rows). Grey dotted lines indicate 0% error and ±10% error.

