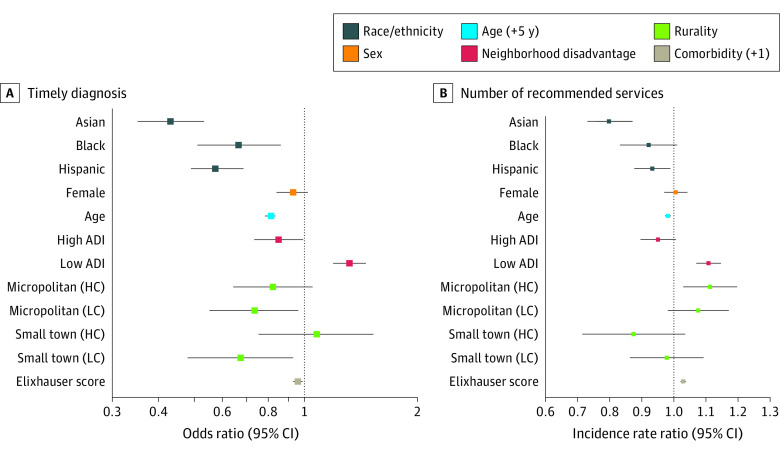
Figure. Adjusted Odds Ratios and Incidence Rate Ratios of Timely Diagnosis and Number of Recommended Diagnostic Services by Race/Ethnicity, Individual Factors, and Contextual Factors.
Dotted line indicates the reference group estimate (White, male, mid–area deprivation index [ADI], and metropolitan). HC indicates high commute; LC, low commute.

