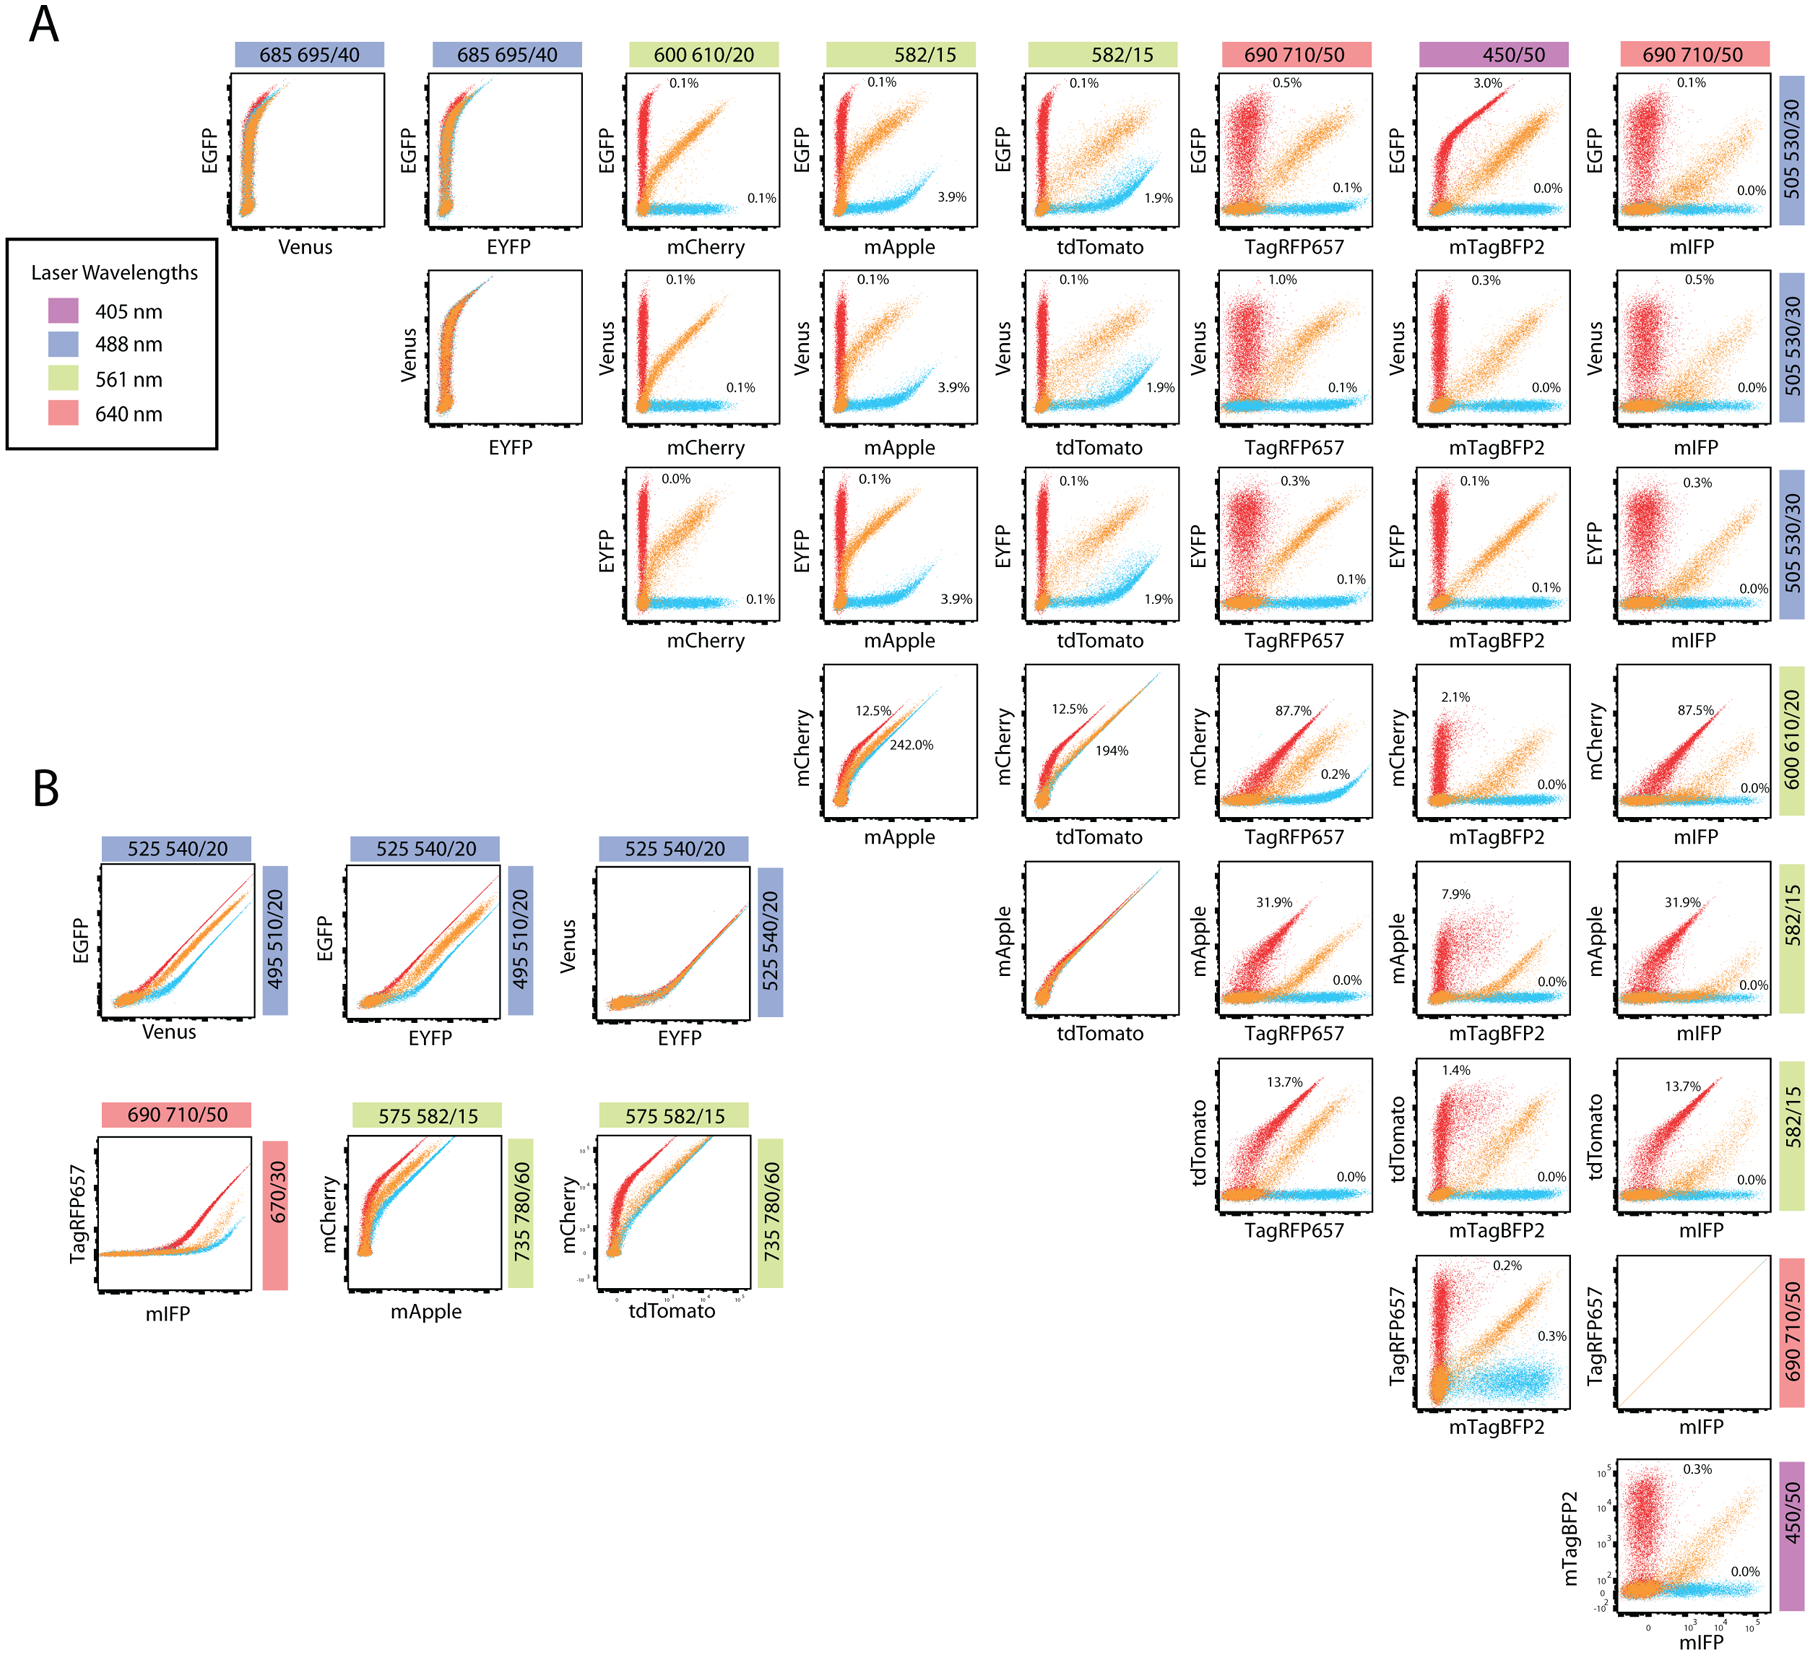
Figure 2 – Specificity of fluorescent protein co-expression.

Colored bars represent laser wavelengths (inset, left). Emission filters used to detect fluorescent proteins listed in colored bar. (A-B) Viral vectors expressing the two fluorescent proteins indicated were co-transfected in 293T cells alone or together. Plots for co-expression (orange) were overlaid with single fluorescent protein expression data (red or blue). (A) Compensation values are indicated, however, plots are displayed without compensation applied. (B) Alternative emission filters for the detection of EYFP/Venus with EGFP; RFP657 with mIFP; mApple with mCherry; and mCherry with tdTomato. No compensation was applied to allow visualization of spectral overlap levels in the other channels.
