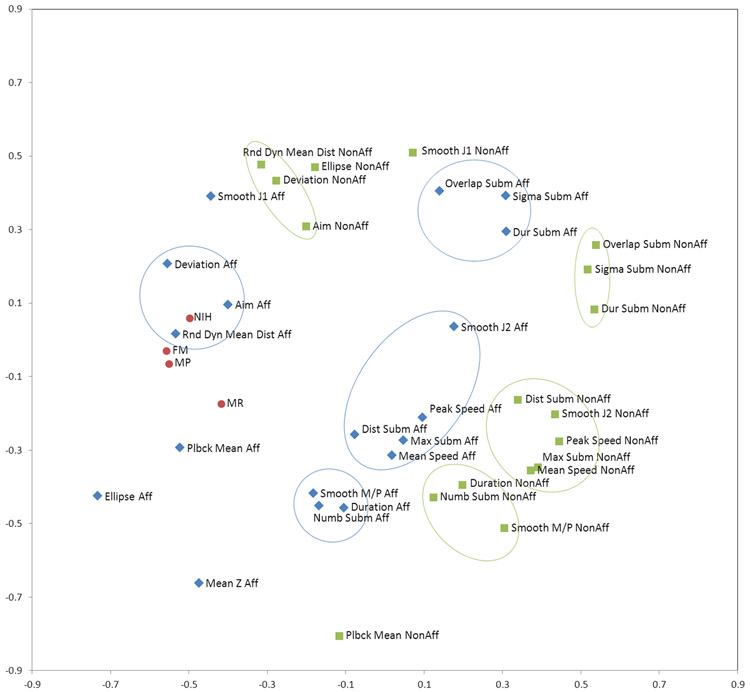
Figure 9.
SPE map of the correlation distances of the clinical and robotic parameters for the completers cohort. The map was derived by computing the pairwise Pearson correlation coefficients (R) for all pairs of features, converting them to correlation distances (1-abs(R)), and embedding the resulting matrix into 2 dimensions in such a way that the distances of the points on the map approximate as closely as possible the correlation distances of the respective features. The clinical parameters are highlighted in red, the robotic parameters on the affected side in blue, and the robotic parameters on the unaffected side in green. The map also shows distinct clusters of correlated variables which are preserved on both the affected and unaffected sides (outlined by green and blue ellipses, respectively).

