
Figure 2.
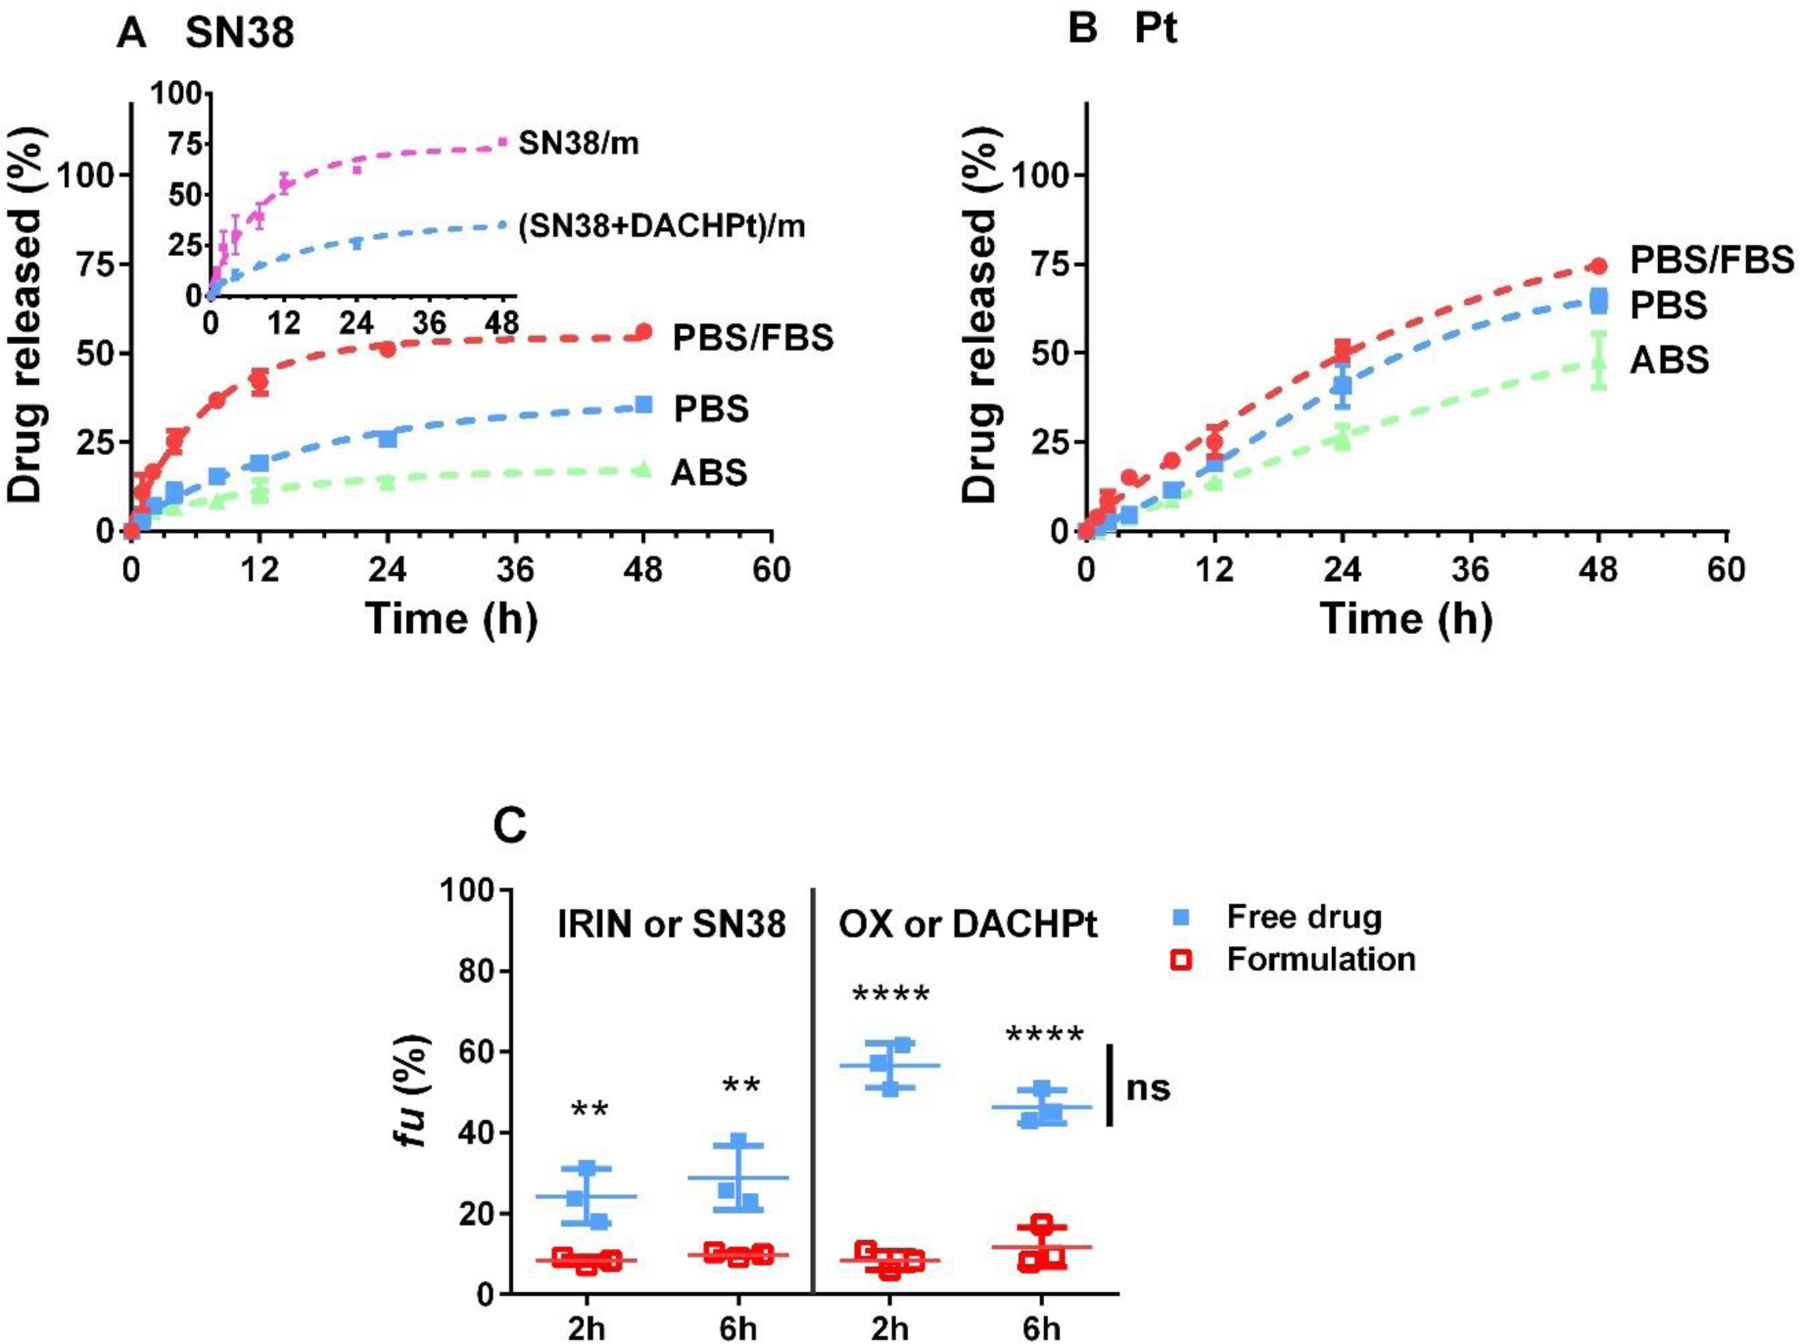
Drug release profiles of (A) SN38 and (B) Pt from (SN38 + DACHPt)/m (1 :1 w/w) in PBS (pH 7.4), ABS (pH 5.5) and PBS in the presence of 10% FBS at 37 °C. Data are expressed as the mean ± SD (n = 3). Insert in (A) shows a comparison of SN38 release profiles from SN38/m and (SN38 + DACHPt)/m in PBS. (C) Average percentage of unbound fraction (fu) of each drug in human whole blood post incubation with (SN38 + DACHPt)/m or combination of free drugs (IRIN + OX) for 2 and 6 hours, at 37 °C. Data are presented as the mean (fu) ± SD (n = 3) and compared by one-way ANOVA with Bonferroni’s multiple comparison test. (**p < 0.01, ****p < 0.0001, ns - not significant).