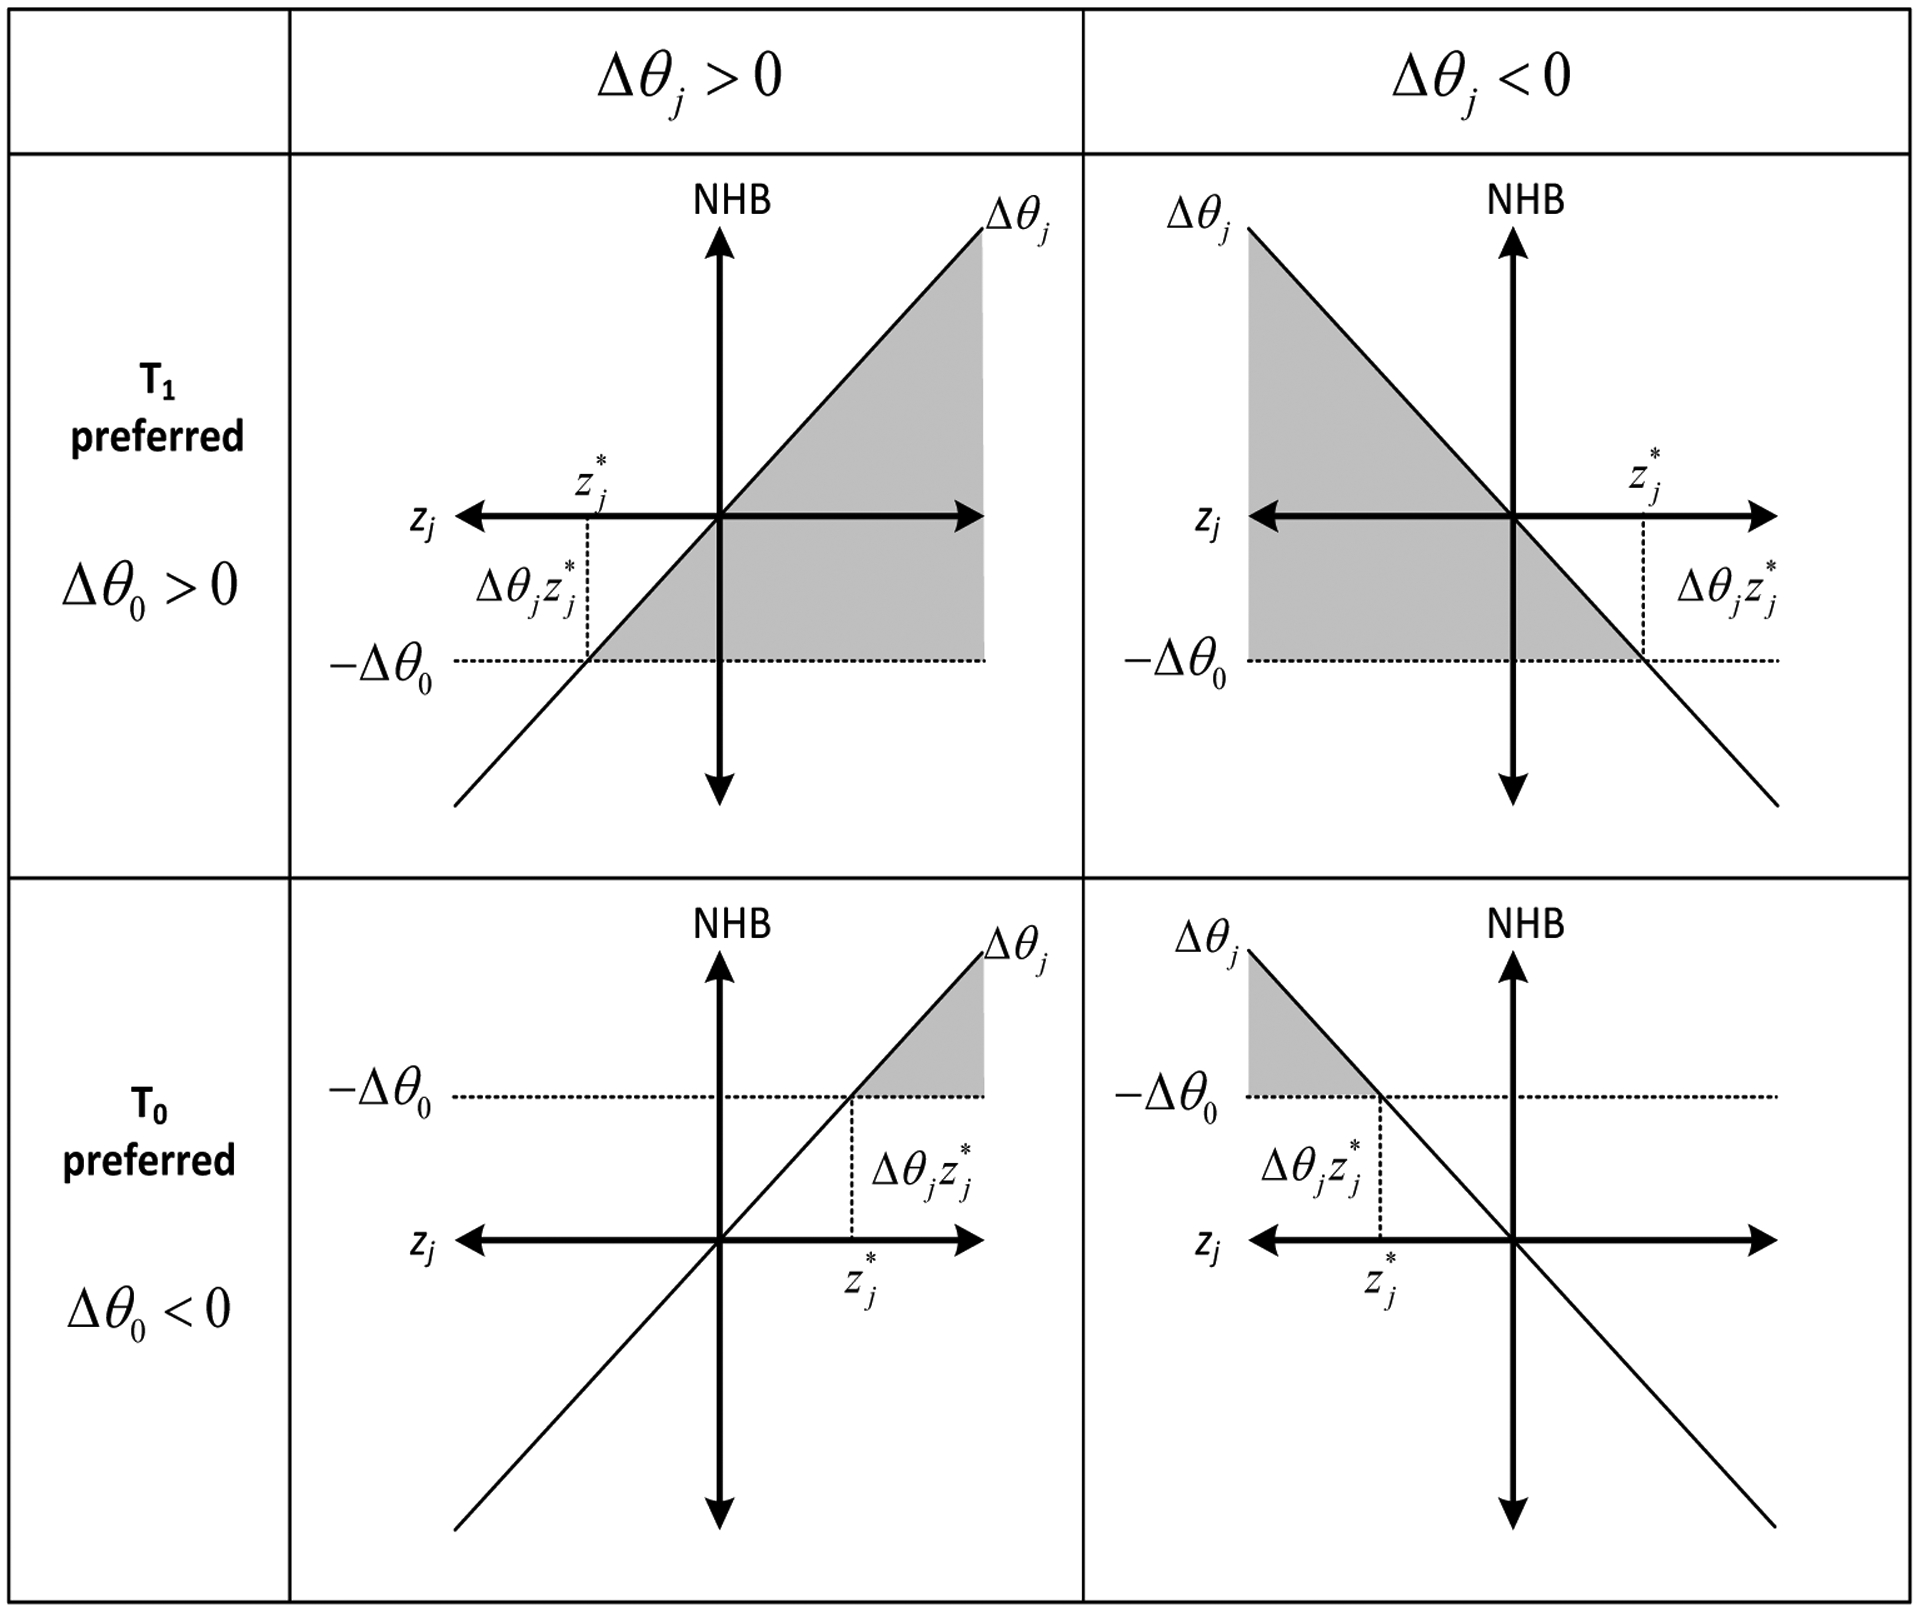
Figure 2: One-way threshold analysis from regression results.

The standardized values of xj are plotted on the X axis, and the NHB is plotted on the Y axis. The horizontal line (−Δθ0) is equal to the negative expected value of the incremental NHB. The grayed out region represents the values of the standardized parameter zj at which the preferred decision is reversed. is the value at which the decision changes and it is a function of the intercept (θ0) and (θj), the coefficient of zj, in the incremental NHB (ΔNHB) regression. The region of zj where T1 is preferred over T0 is conditional on the direction of Δθj which indicates the direction in which ΔNHB changes relative to zj. If Δθj > 0, meaning that ΔNHB increases as zj increases, then T1 becomes preferred over T0 where . However, if Δθj is a negative value, then T1 must be preferred over T0 in regions where .
