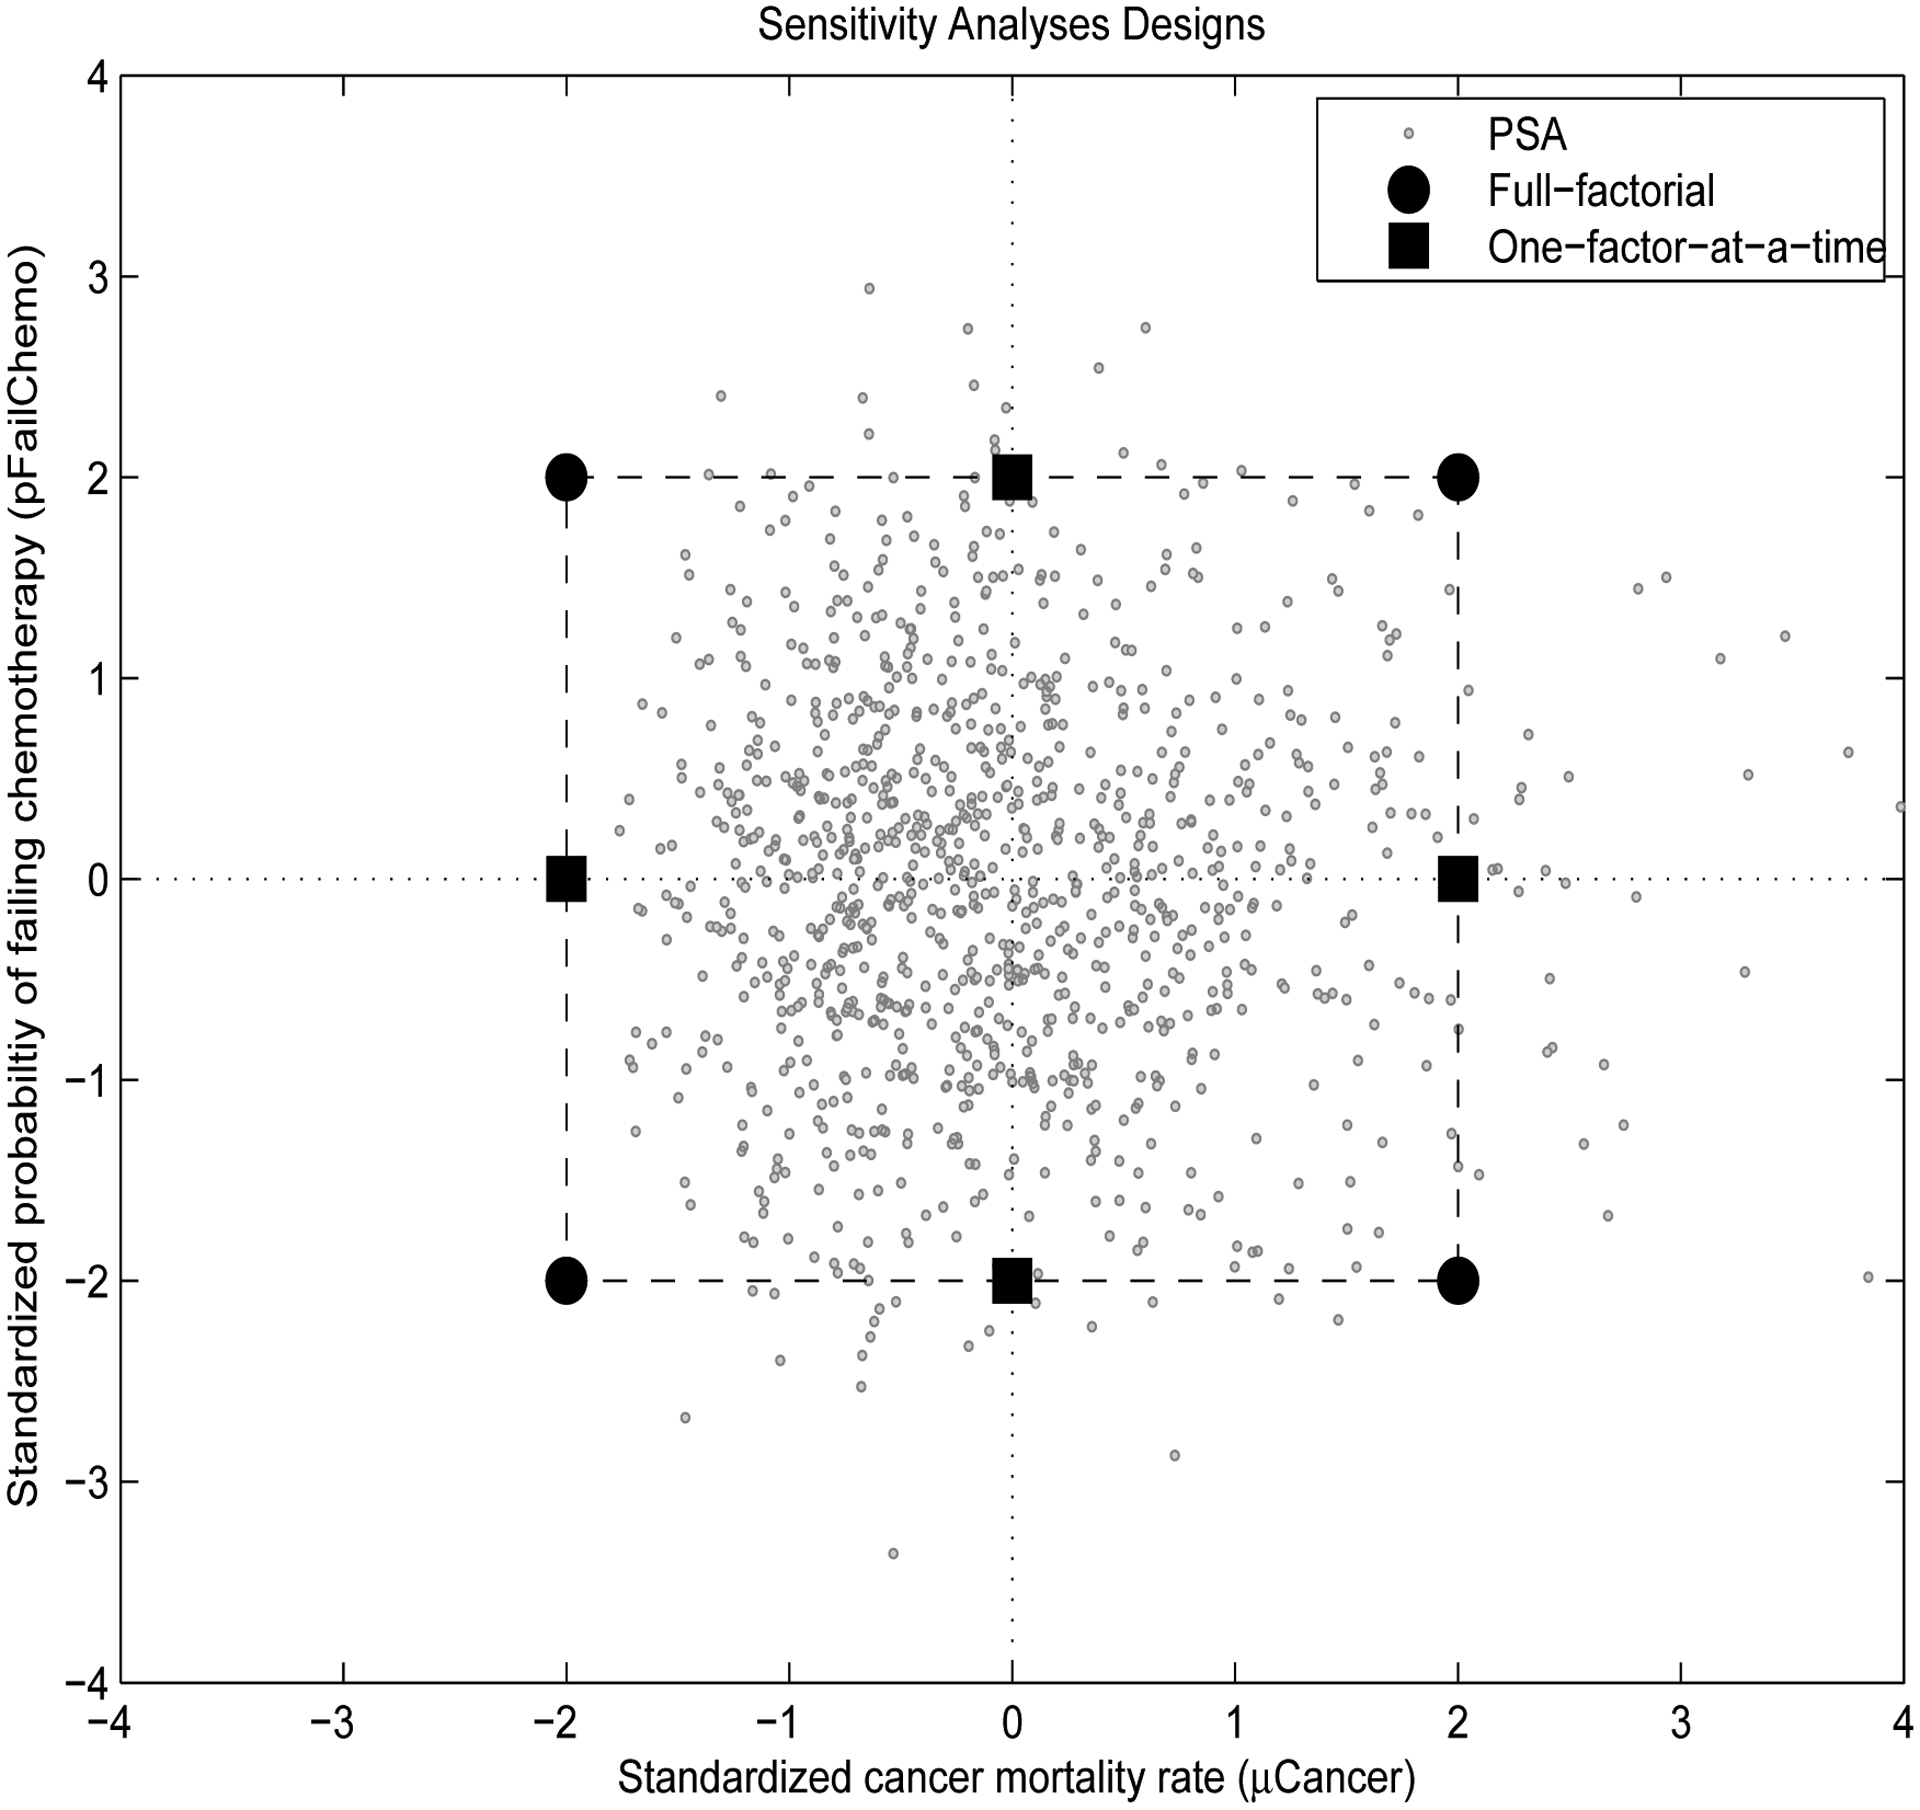
Figure 4: Sensitivity analysis design.

This figure shows how two parameter values are sampled in different types of simulation designs. Cancer mortality rate (μCancer) is plotted on the X axis and the probability of failing chemotherapy (pFailChemo) is plotted on the Y axis. In probabilistic sensitivity analysis (PSA), 1000 parameter pairs are sampled randomly from their distributions (Table 1). In deterministic designs, the analyst chooses the input values. In 2K full-factorial design, the inputs are sampled from the edges, or corners, of the parameter space. In contrast, in one-factor-at-a-time design, only one parameter is varied at a time, the other parameter is held at its mean value.
