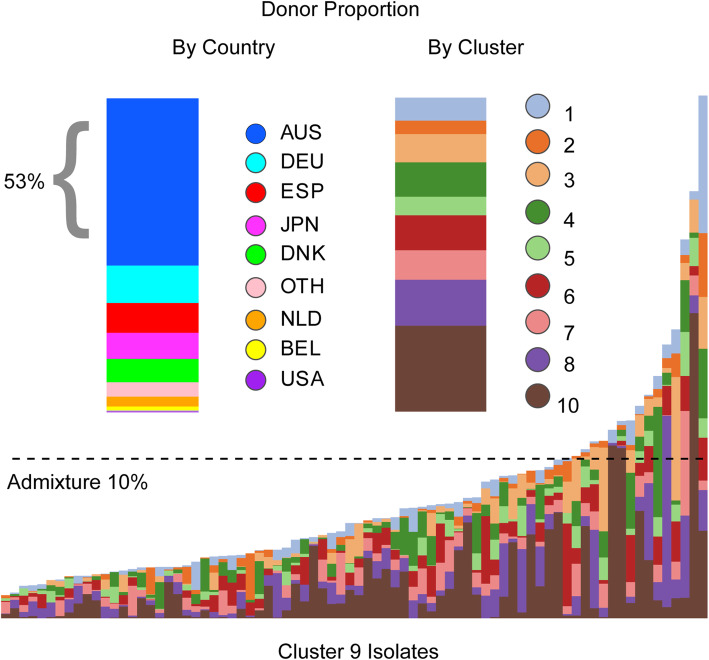
Fig. 4.
Cluster 9. The bottom panel along the x-axis represents individual cluster 9 isolates (originating exclusively from Australia) with coloured vertical bars showing individual admixture signals across their core-genome by donor cluster. The dashed line depicts an admixture threshold of 10%. The top half of the panel reflects the proportions of admixed regions by donor country (left) and donor cluster (right). Overall, cluster 9 isolates share the majority of their genome co-ancestry (between 61% and 98%) with other cluster 9 isolates. In admixed regions, the best genomic match to the donor cluster originated from another Australian isolate in 53% of cases

