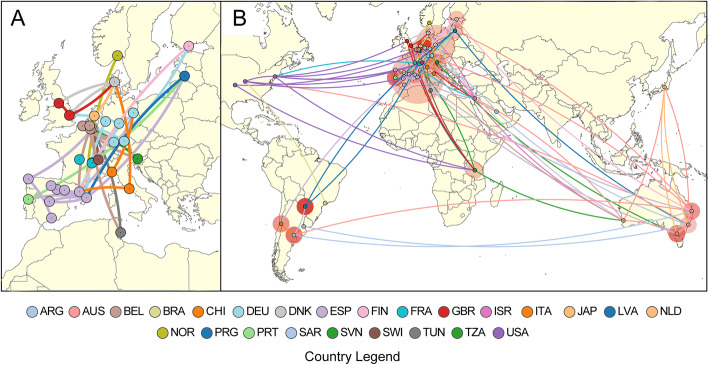
Fig. 5.
Dissemination routes of E. faecium across the world. Worldwide dissemination of genomes belonging to cluster 2 (n = 122) analysed using spatial, temporal and genomic data through BEAST v2.6 and visualised using SpreaD3. Coloured nodes on the map represent an isolate’s country of origin (as shown in the legend), while connecting lines are coloured by destination location. An expanded view is shown in panel a to show inferred spread of E. faecium isolates across Europe with complex links between and within countries. b E. faecium dissemination across the globe with surrounding circle sizes proportional to the number of lineages (isolates that share the same continuous line of ancestry) that occur in that location and captures the absolute and relative intensity of the local spread at any given point in time

