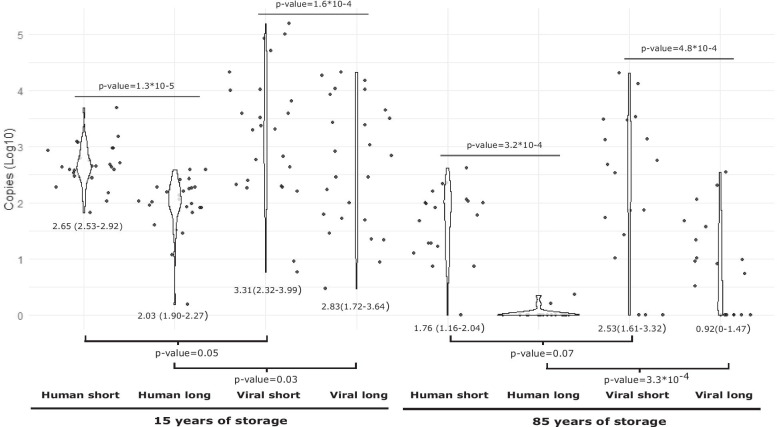
Fig. 1.
Violin plots comparing the distribution of the quantification values by gene, amplicon size and storage time including only the subset of samples fixed in formalin. For each period of time, median values of copies/µL (depicted as Log10) per amplicon either between host and virus or for the two different amplicons within host and within viruses are compared by means of a Wilcoxon Mann–Whitney test. For each comparison, p-values for the null-hypothesis of non-different median values between the corresponding distributions are indicated. Fragments are represented as follows: “Human short” to represent 65 bp tubulin-β gene amplicon; “Human long” to represent 149 bp tubulin-β gene amplicon; “Viral short” to represent 69 bp L1 gene amplicon and “Viral long” to represent 134 bp L1 gene amplicon. Each period of time is represented below fragments

