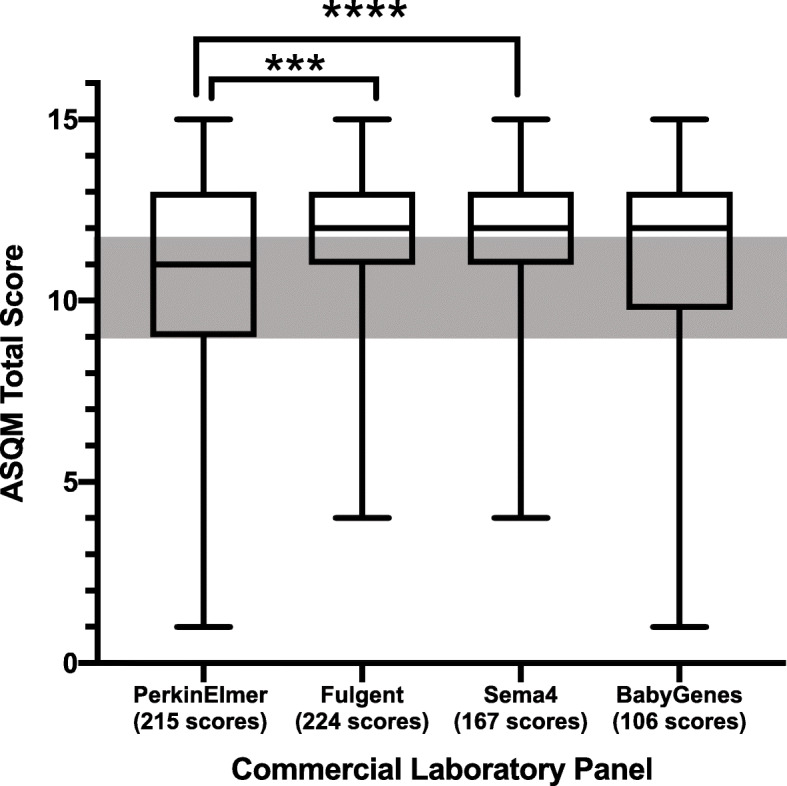
Fig. 2.

Comparison of ASQM total scores for genes on commercial laboratory NBS panels. Box and whisker plot of ASQM score distributions for 215 genes on PerkinElmer’s panel, 224 scores on Fulgent’s panel, 167 genes on Sema4’s panel, and 106 genes on BabyGenes’ panel. All genes that were scored using the ASQM were used for comparison, regardless of category. The gray box represents the area where genes-disease pairs scoring 9, 10, or 11 could not be automatically categorized and necessitated further discussion by the scoring committee prior to final categorization. Distributions varied significantly across all panels by Kruskal–Wallis test (p < 0.0001), and paired Mann–Whitney U tests identified significant differences between PerkinElmer and Fulgent panels' ASQM gene-disease pair scores (***p = 0.0001) and between PerkinElmer and Sema4 panels' ASQM gene-disease pair scores (****p < 0.0001)
