Fig. 1.
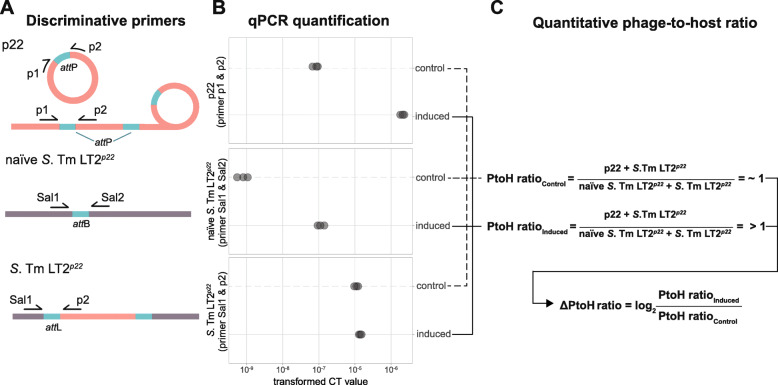
Establishment of quantitative reference values for the induction of prophage p22 in S. Tm LT2p22. a The schema illustrates the different primer combinations that were used to amplify genomic regions that are indicative of circularised and concatemeric prophage p22 genomes (top), naïve S. Tm LT2p22 genomes lacking the p22 prophage (middle) and lysogenic S. Tm LT2p22 genomes (bottom) owing to the primers targeting either bacterial (grey) or viral (red) DNA sequence present next to the attachment site sequences attP, attB and attL (turquoise), respectively. The three different primers pairs are shown as black arrows. Sal1 and Sal2 target bacterial and p1 and p2 viral DNA sequences. b Quantitative PCR readouts from non-induced (n=3, control) and mitomycin C-induced (n=3, induced) S. Tm LT2p22 cultures. The different primer combinations targeting attP, attB and attL allow for determining the quantity of naïve S. Tm LT2p22, S. Tm LT2p22 and induced p22 within a single culture. The transformed cycle threshold (CT) values are proportional to the amount of template DNA in each sample. The data suggest that upon induction, p22 and naïve S. Tm LT2p22 genome copy numbers increase as a consequence of p22 excision. A non-homogeneous induction of S. Tm LT2p22 cells in the treated culture with growth of non-induced S. Tm LT2p22 cells over the period of 24 h is most likely the explanation for unchanged CT values between control and induced S. Tm LT2p22 cultures. c PtoH ratios measure the activity of p22 by assessing the relative copy number of phage genomes per host genomes. To this end, we compared the amount of viral DNA from S. Tm LT2p22 (using primers Sal1 & p2) and induced p22 (using primers p1 & p2) genomes to the combined amount of bacterial DNA from S. Tm LT2p22 (using primers Sal1 & p2) and naïve S. Tm LT2p22 (using primers Sal1 & Sal2) genomes within control and induced cultures. PtoH differences were calculated as the mean log2-fold change (l2fc) between induced and control cultures (ΔPtoH ratio)

