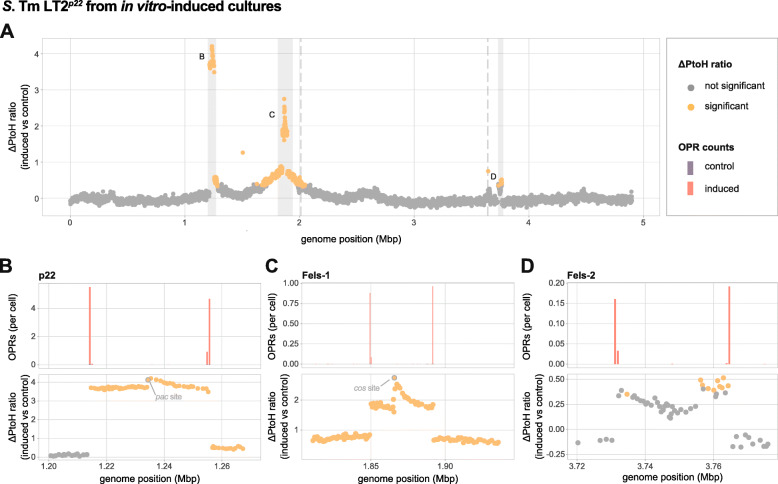
Fig. 3.
ΔPtoH ratio and replication modes of induced S. Tm LT2p22 prophages determined by high-throughput sequencing. (a) ΔPtoH ratio of each gene in mitomycin C-induced (n=3) S. Tm LT2p22 cultures shown as mean l2fc. The fold change in read coverage for each gene was evaluated using the DESeq2 package. Statistical significance required both a significant change of read coverage between induced and control cultures (Wald test; p value<0.05 after Benjamin Hochberg correction) and a l2fc higher than one standard deviation of the mean l2fc of all non-prophage genes. Data points in plots represent all protein-coding S. Tm LT2p22 genes and are shown in orange if the l2fcs were statistically significant (otherwise in grey). The l2fcs along the S. Tm LT2p22 genome resemble a one-sided and a two-sided tent-like shape around the genomic locations of the phages p22 (1,213,987-1,255,756) and FELS-1 (1,849,458-1,892,188). The grey dashed lines indicate the locations of the prophages Gifsy-2 and Gifsy-1. Detailed views of the genomic locations of the prophages p22 (b), Fels-1 (c) and Fels-2 (d). Mean OPR counts in induced (red) and control (dark purple) cultures are shown in the upper panel. Each bar represents the normalised mean count of OPRs that were aligned within the shown regions. The individual OPR counts per sample were normalised by the sample-specific median insert coverage of 10 single-copy MGs to yield OPR counts per cell before the overall mean OPR counts was calculated. The lower panel shows the patterns of the ΔPtoH ratio for each prophage and adjacent host regions. Orange data points with grey borders denote the genes containing the packaging site pac for p22 and cos for Fels-1

