Fig. 4.
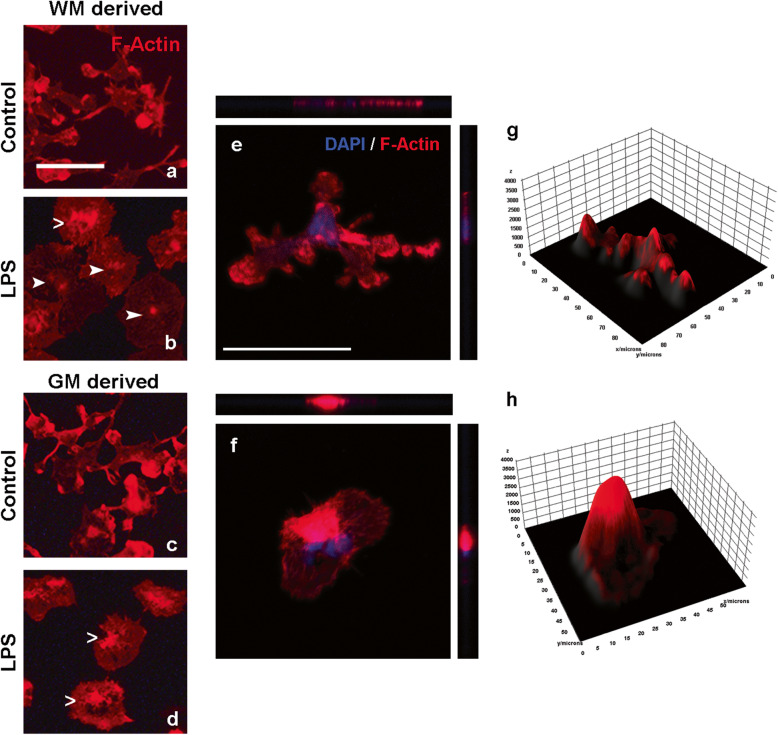
Representative images of F-actin labeling. WM-derived (a, b) and GM-derived microglia (c, d) left untreated or treated with LPS. Arrows indicate subtle differences in F-actin signals within the cells treated with LPS: open arrows highlight the stronger F-actin signal localized to the middle of the cell which was visible in nearly all GM-derived microglia treated with LPS and some WM-derived microglia treated with LPS; closed arrows point to a more diffuse and weaker staining of F-actin, visible in WM-derived microglia treated with LPS only. Confocal images with orthogonal slices showing the z-axis of a ramified microglia (e) and amoeboid microglia (f). Surface plots of the same ramified (g) and amoeboid (h) microglia showing the intensity of the rhodamine phalloidine signal (y-axis) which can be considered a measure for the amount of F-actin in the cell and the size of the cells in micrometers (x-axis). Scalebars (a–f) = 50 μm

