
Figure 5 –
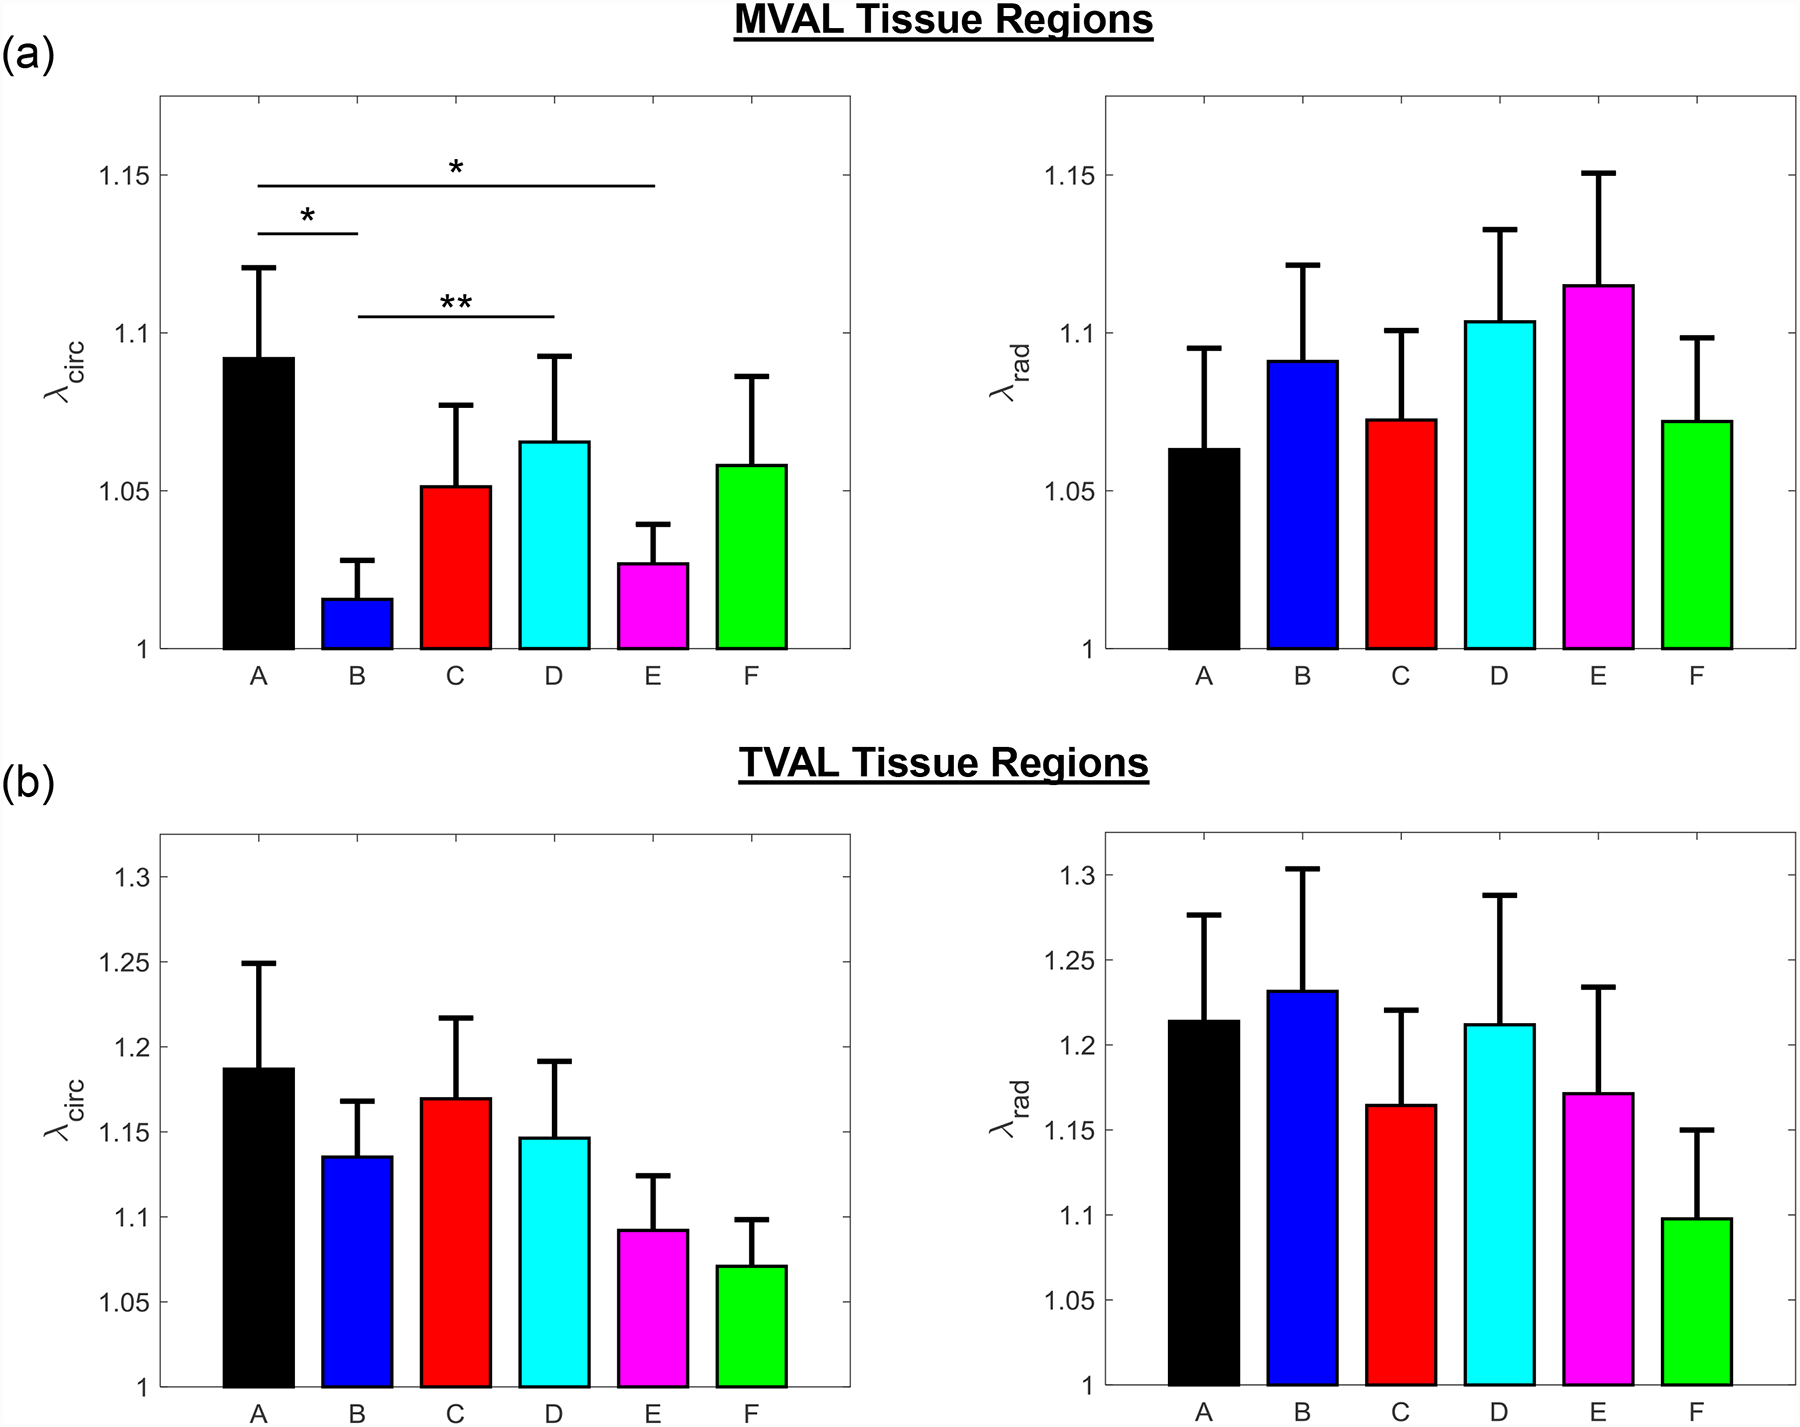
Mean ± SEM of the preconditioning stretches ( and ) of (a) the six MVAL tissue regions and (b) the six TVAL tissue regions in both the circumferential (left) and radial (right) directions. (*) denotes statistically significant (p<0.05) difference between groups and (**) denotes nearly statistically significant (0.05<p<0.10) difference between groups; otherwise, not statistically significant (p>0.10).