
Figure 7 –
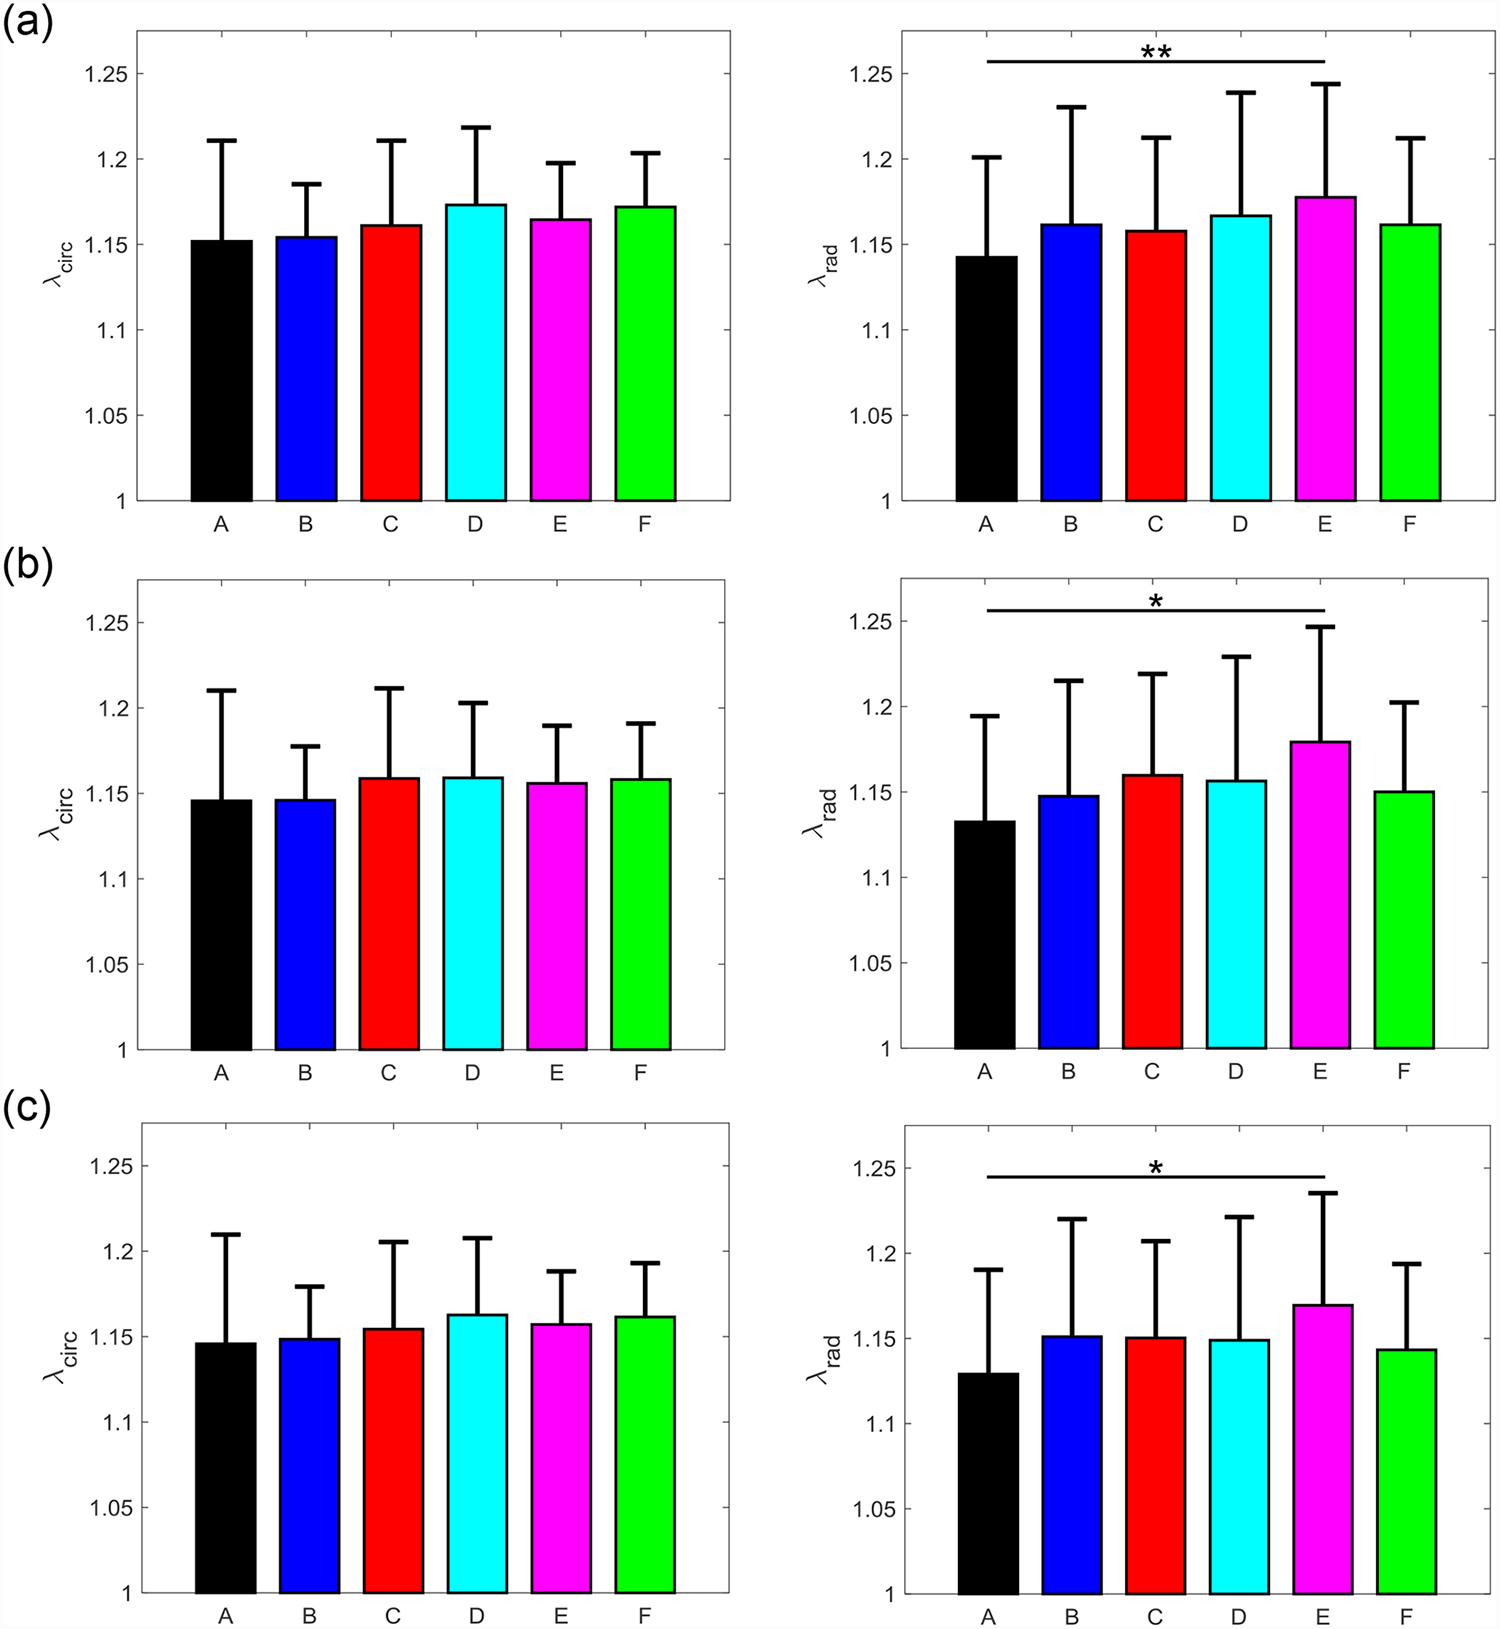
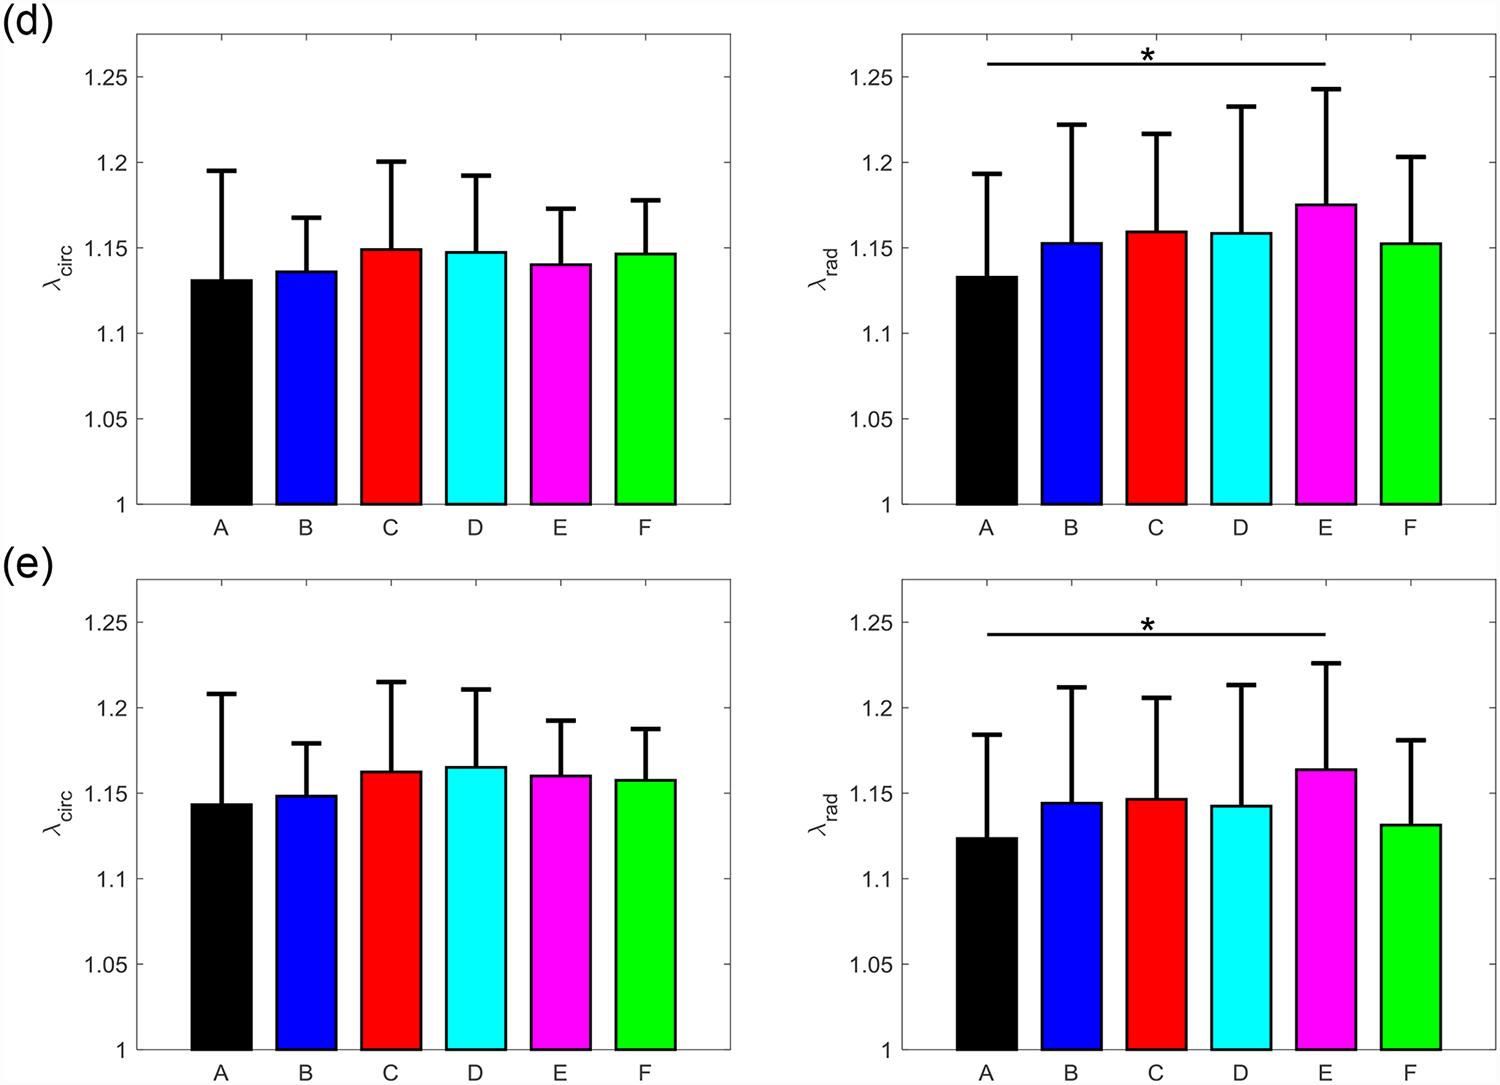
Mean ± SEM of the mechanical stretches of all the six TVAL tissue regions in both the circumferential (left) and radial (right) directions under 5 loading protocols: Tcirc,max:Trad,max = (a) 1:1, (b) 0.75:1, (c) 1:0.75 (d) 0.5:1, and (e) 1:0.5. (*) denotes statistically significant (p<0.05) difference between groups and (**) denotes nearly statistically significant (0.05<p<0.10) difference between groups; otherwise, not statistically significant (p>0.10).