
Figure 8 –
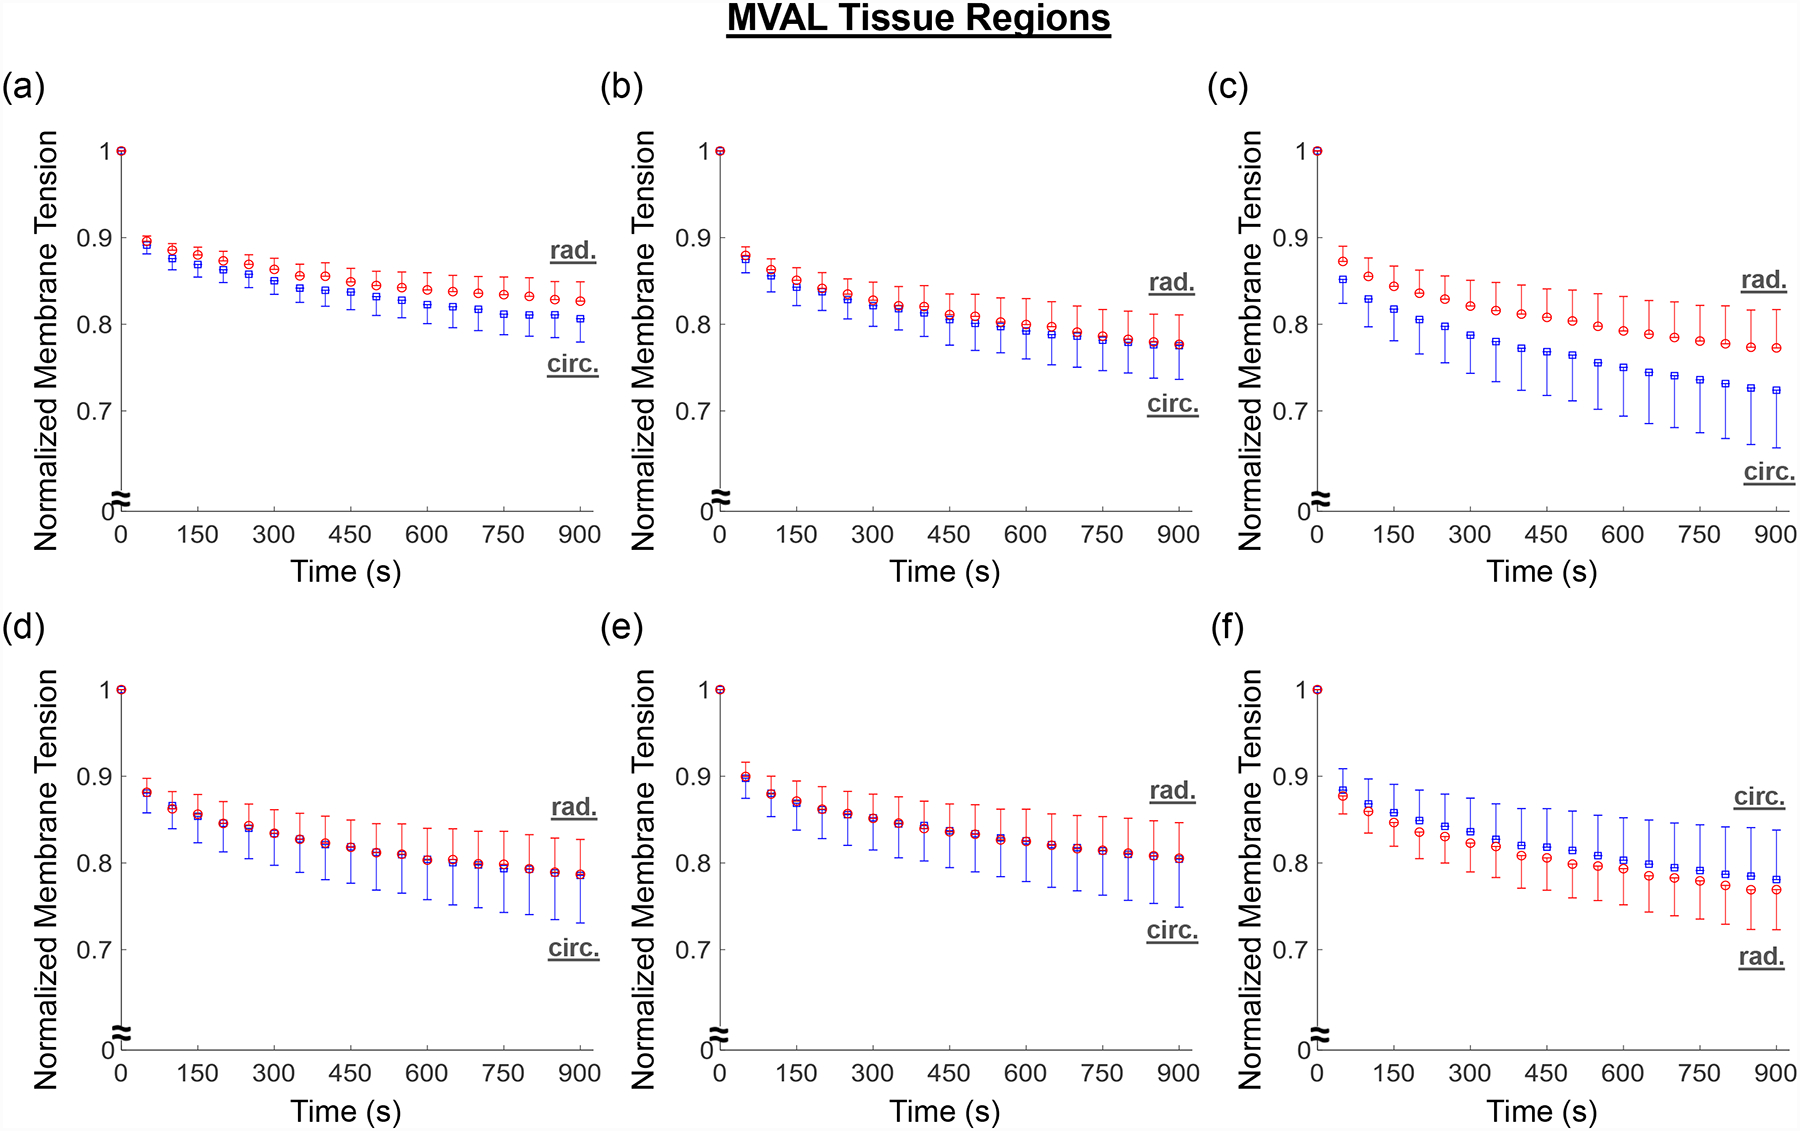
Mean ± SEM of the normalized membrane tension versus time results from the stress relaxation testing for all the six MVAL tissue regions.
Official websites use .gov
A
.gov website belongs to an official
government organization in the United States.
Secure .gov websites use HTTPS
A lock (
) or https:// means you've safely
connected to the .gov website. Share sensitive
information only on official, secure websites.
Mean ± SEM of the normalized membrane tension versus time results from the stress relaxation testing for all the six MVAL tissue regions.