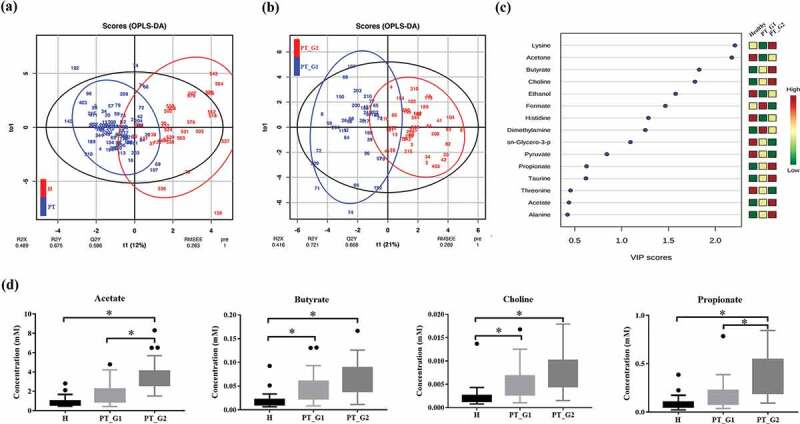
Figure 1.

Saliva NMR data analysis. (a) OPLS/DA score plot of the spectra of saliva samples obtained from the healthy (H) and periodontitis (PT) groups. The saliva sample score plots of the H group were dispersed, while those of the PT group were clustered. (b) OPLS/DA score plot of PT patients. The patients were clustered into two subgroups (PT_G1 and PT_G2) (c) Variable Importance in Projection (VIP) scores of the important discriminatory metabolites obtained from the OPLS-DA models. (d) Metabolites identified to discriminate the H, PT_G1, and PT_G2 groups. * p < 0.05
