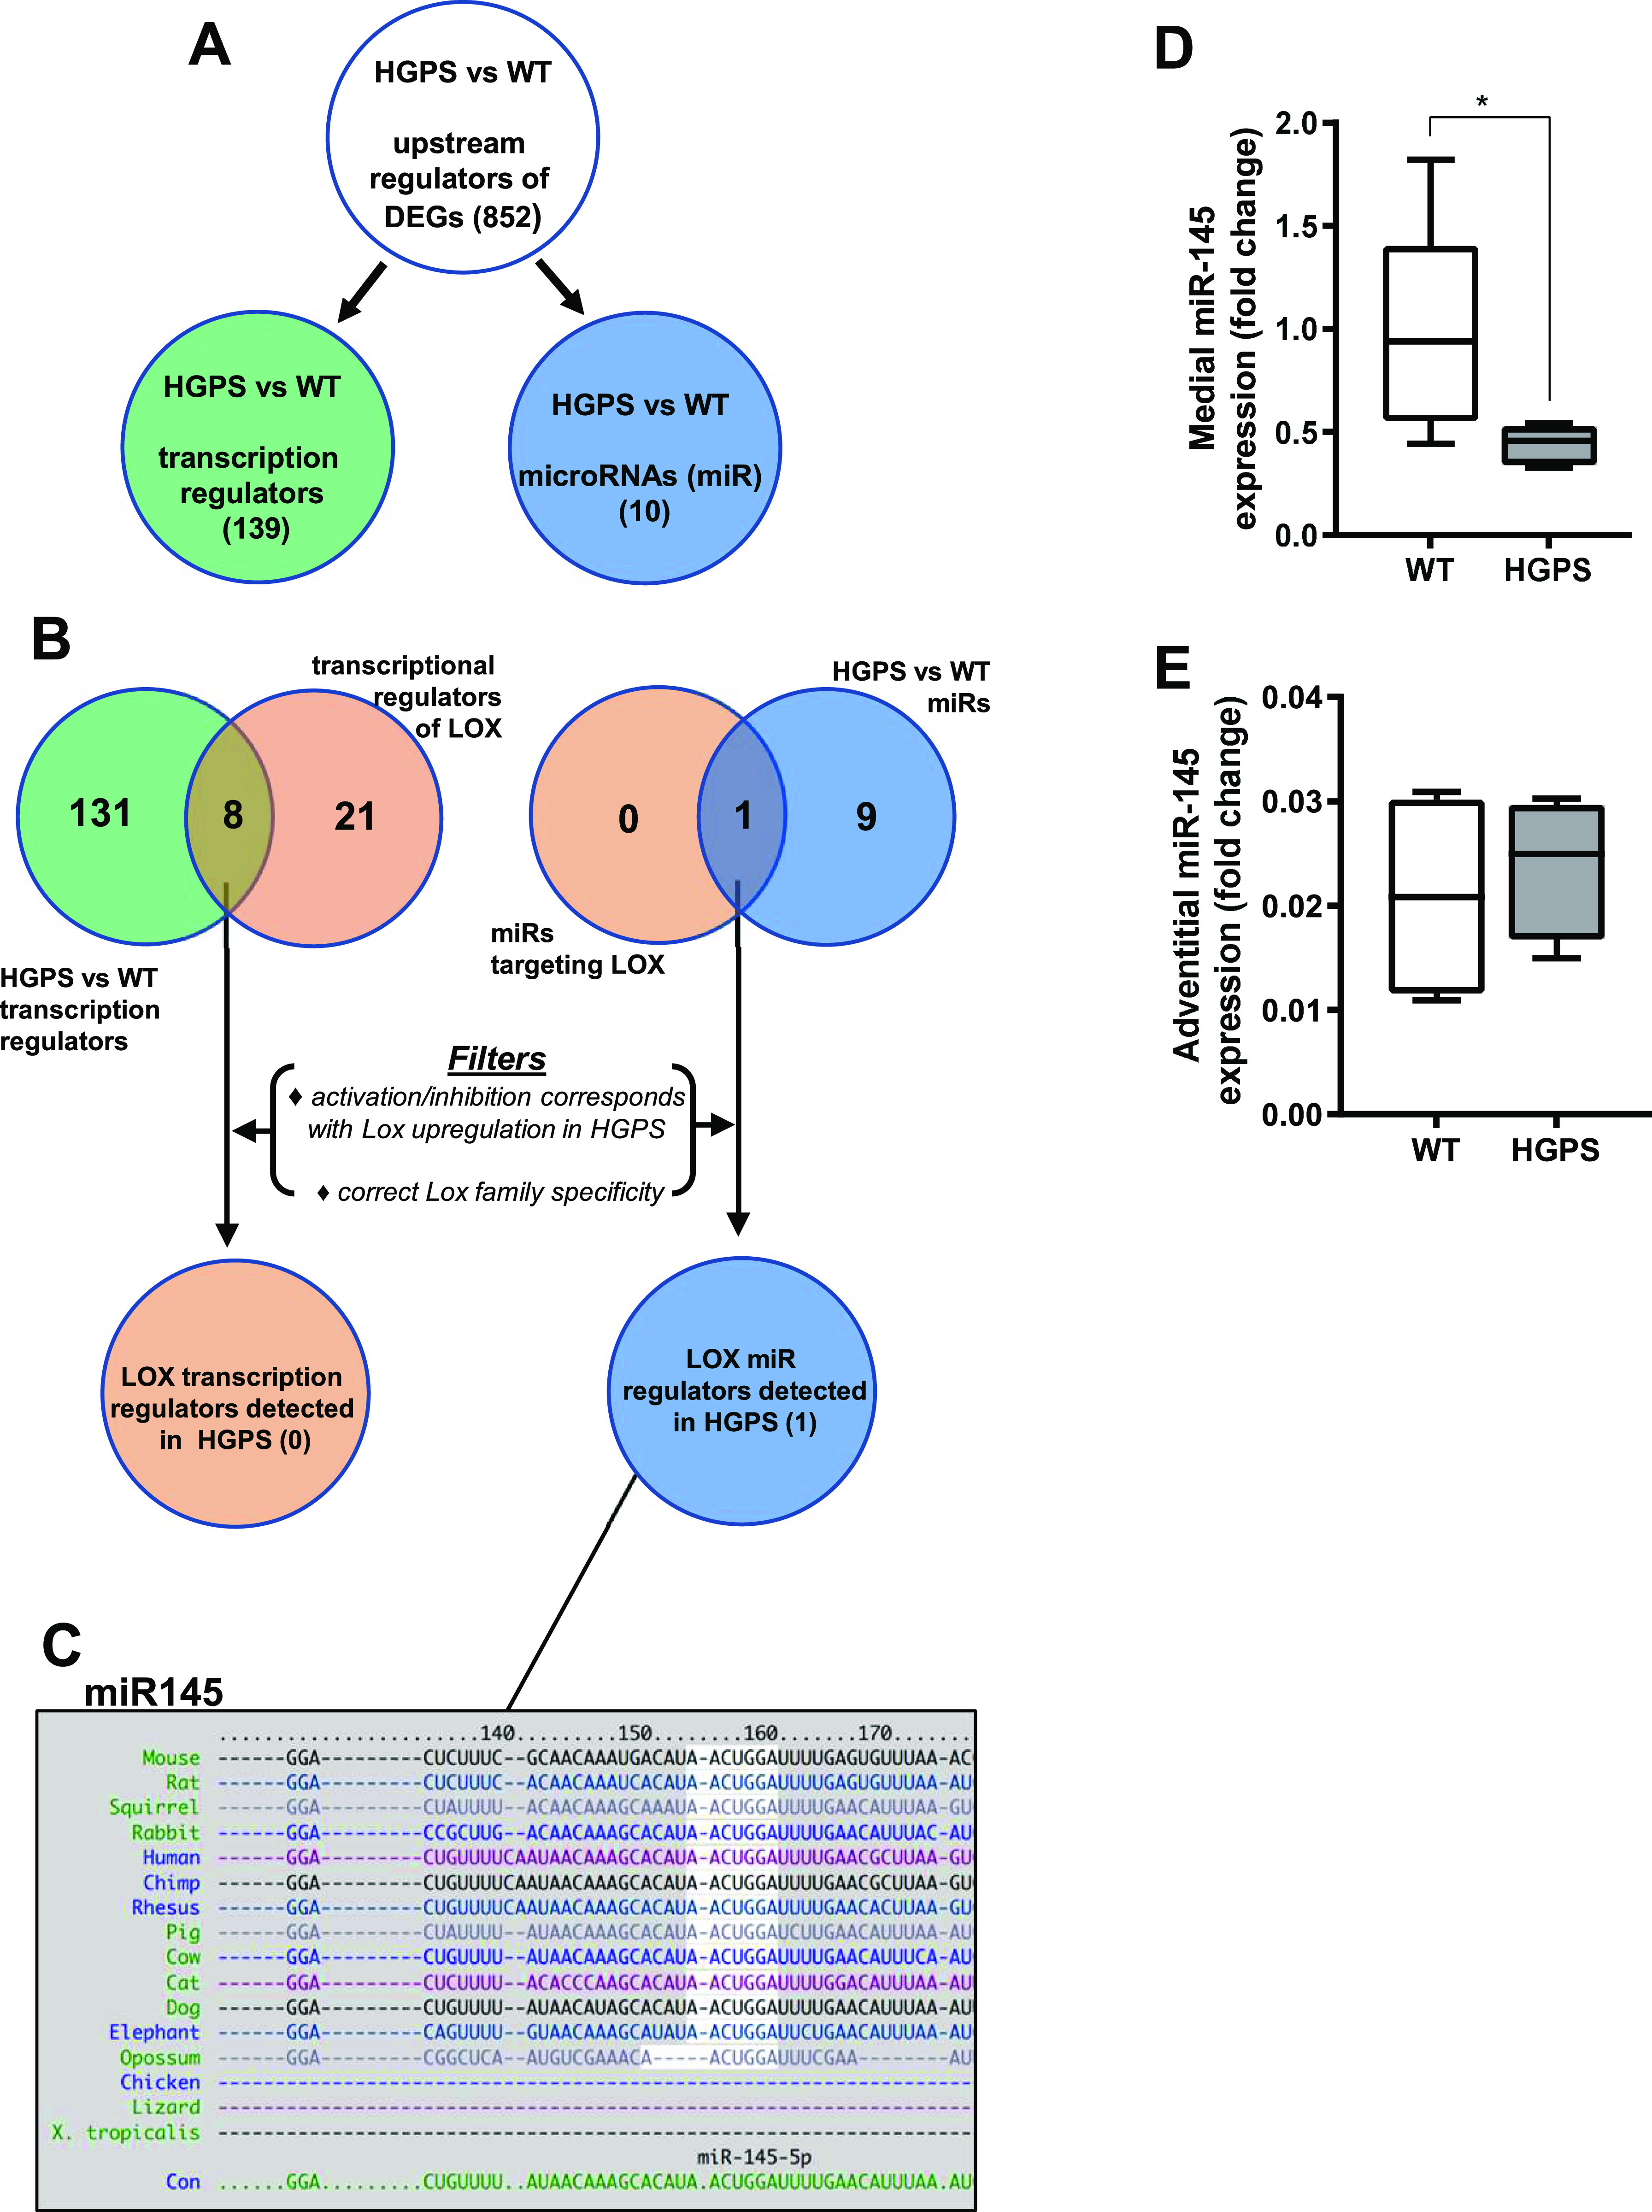
Figure 6. Hutchinson–Gilford Progeria Syndrome (HGPS) aortic tissues show reduced miR-145 transcript levels.

RNA-sequencing analysis was performed (see the Materials and Methods section) on cleaned aortas from 2-mo WT and HGPS mice (n = 6 per genotype) to identify potential upstream regulators of LOX. (A) The number of activation or inhibition signatures in the HGPS versus WT aortas was inferred from an Ingenuity Pathway Analysis of differentially expressed genes, and the list of total activation/inhibition signatures (top) was subdivided into transcription regulators and microRNAs. (B) Venn diagram identifying the number of activation/inhibition signatures in HGPS categorized as either transcription regulators (left, green) or microRNAs (right, blue) were compared with known transcriptional or microRNA regulators of LOX identified from Ingenuity Pathway Analysis (beige). The likelihood of the eight transcription regulators and one miR accounting for LOX up-regulation in HGPS was then considered individually using the criteria shown (“Filters”). (C) TargetScan depiction of the conserved 3′ UTR miR-145-5p target sequence in LOX. (D, E) miR-145 transcript levels from the medial layer (n = 6) and (E) adventitial layer (n = 4) of 2-mo WT and HGPS mice. miR-145 transcript levels were normalized to WT media values. Statistical significance was determined by Mann–Whitney tests.
