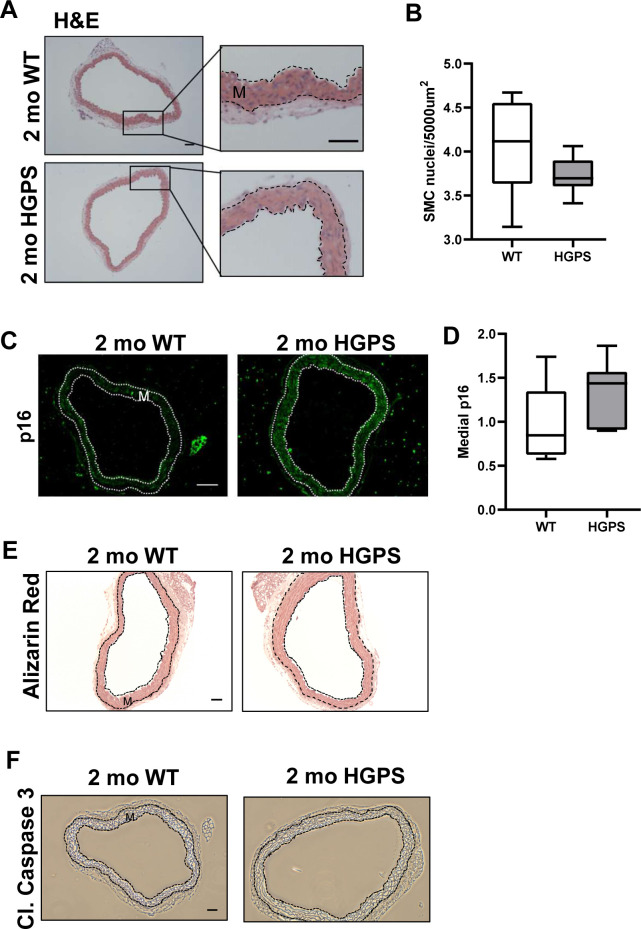
Figure S10. Characterization of 2-mo WT and Hutchinson–Gilford Progeria Syndrome (HGPS) aortas.
(A, B) WT and HGPS aortic cross sections were characterized for overall morphology and smooth muscle cell number by H&E staining. The number of smooth muscle cell nuclei was quantified (n = 7 mice per genotype, three sections per mouse). (C, D) 2-mo WT and HGPS aorta were immunostained with anti-p16 (n = 7), and signal intensity in the medial layer (dashed lines) was quantified and normalized to 2-mo WT. (E) Calcification was assessed by alizarin red staining (n = 4), with bone tissue used as a positive control as in Fig S3. Scale bar in panels (A, B, C, D, E) = 100 mm. (F) Apoptotic cells were assessed in WT and HGPS aortas by staining for cleaved caspase-3 (scale bar = 50 mm, n = 4) with tumor tissue used as positive control as in Fig S3. Medial layer is outlined in dashed lines and marked with “M.”

