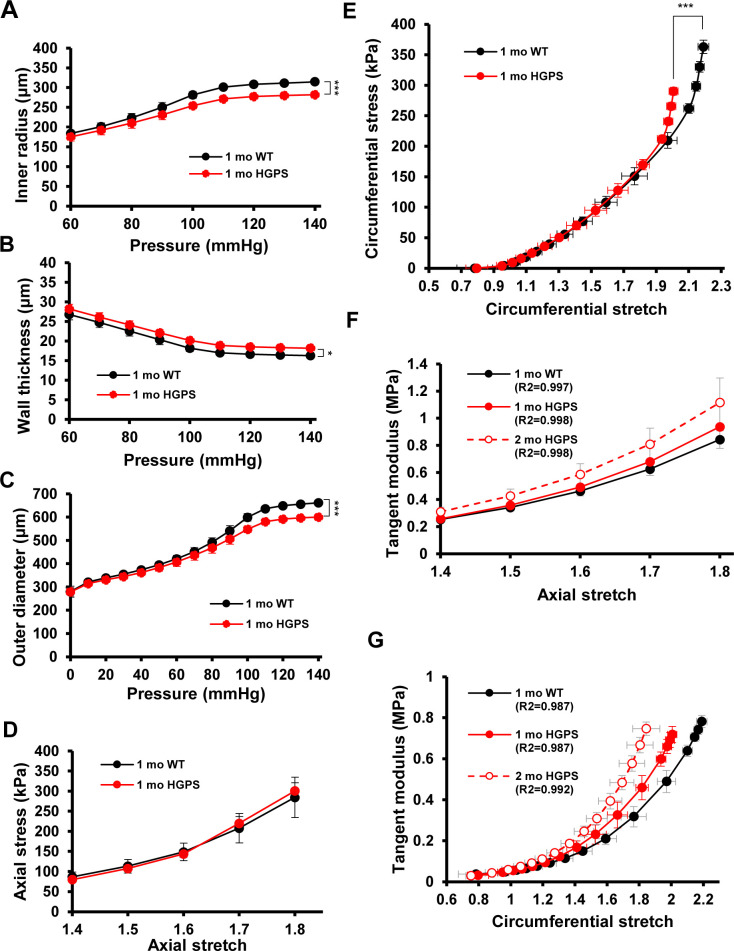
Figure S6. Mechanical properties of 1-mo WT and Hutchinson–Gilford Progeria Syndrome (HGPS) carotid arteries.
Carotid arteries from mixed sex 1-mo WT (n = 5) and HGPS (n = 5) mice were analyzed by pressure myography. (A, B, C) Changes in inner radius, wall thickness, and outer diameter with pressure. Results show mean ± SE. (D) Axial stress–stretch curves performed at 80 mm Hg. Results show mean ± SD. (E) Circumferential stress–stretch curves. Results show mean ± SE. Statistical significance in (A, B, C, D, E) was determined by two-way ANOVA. (F, G) Derived axial and circumferential tangent modulus versus stretch plots. Male 2-mo HGPS tangent curves were reproduced from Fig S2 for reference (dashed red line).

