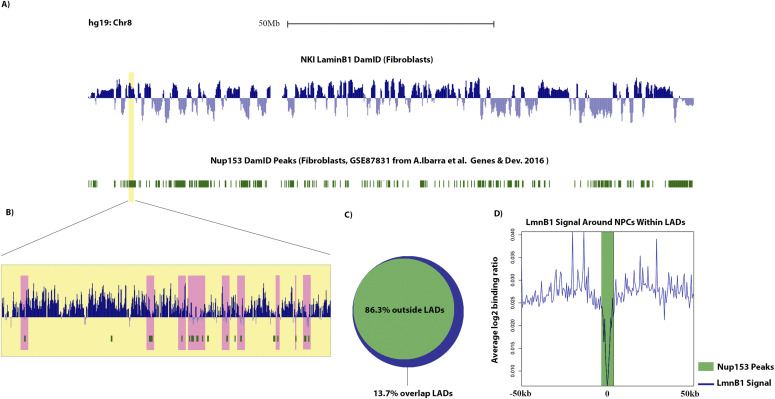
Figure 4.
Nup153 interacts with lamins, but not LADs (Zone 1). (A) Log2 ratio plots from human fibroblasts (hg19 build) chr 8 of LmnB1 DamID (blue) and Nup153 DamID peaks in green (10, 73). (B) Inset shows a magnified view of a lamina-associated domain (LAD) that appears to be highly dense with Nup153 binding sites. (C) Venn diagram showing the percentage (in base coverage) of Nup153 distribution relative to LADs. (D) LmnB1 profile anchored at all LAD-Nup153 peaks (the 13.7% that are found within LADs) centers. Line graphs represent the average trend across all such Nup153 peaks.

