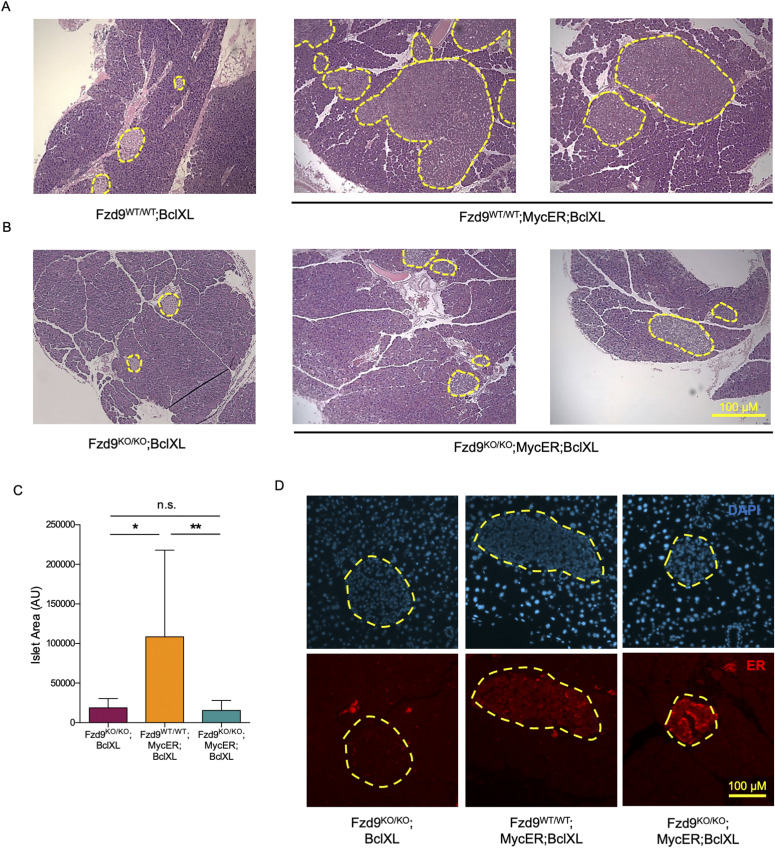
Figure 1. The absence of Fzd9 impairs the development of Myc-driven pancreatic insulinomas.
(A, B) H&E staining (4×) of pancreas sections from Fzd9-proficient and (B) Fzd9-deficient mice treated with tamoxifen for 3 wk. (C) Quantification of the islet size from Fzd9KO/KO;BclXL, Fzd9WT/WT;MycER;BclXL and Fzd9KO/KO;MycER;BclXL mice. (D) Presence of MycER detected by immunofluorescence against ER (red) in these 3-wk treated islets. Yellow dotted lines define the periphery of the pancreatic islets. Representative images for each of the groups are shown (10×). Data information: in (C), data are represented as mean ± SD. * and ** indicate P-values below 0.05 and 0.01, respectively (Kruskal–Wallis followed by Dunn’s test). (A, D) Scale bars: 200 μm in (A), 100 μm in (D).

