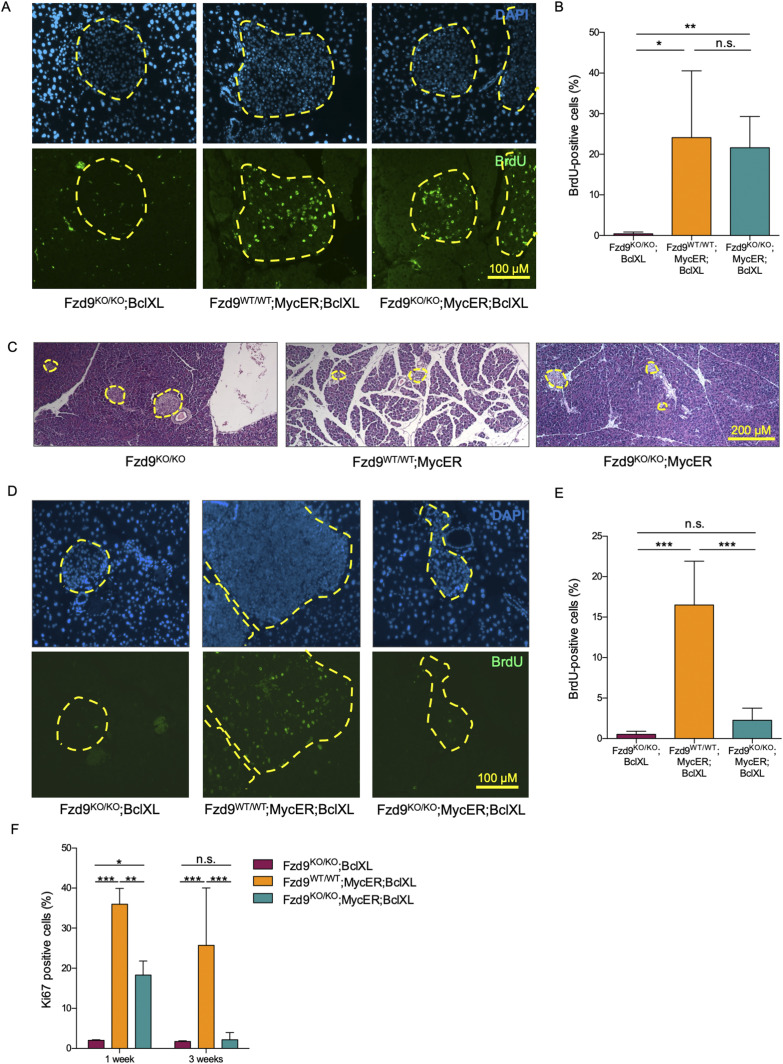
Figure 2. Sustained proliferation of pancreatic islets upon MycER activation requires Fzd9.
(A, B) Incorporated BrdU (green) detected by immunofluorescence (10×) after 3 d of tamoxifen treatment and (B) its quantification. Percentages of BrdU-positive cells per islet from at least three mice per group are represented. (C) Representative H&E staining of pancreas sections from mice treated with tamoxifen for 3 d. Yellow dotted lines define the periphery of the pancreatic islets (4×). (D, E) Incorporated BrdU detected by immunofluorescence (10×) after 3 wk of tamoxifen treatment and (E) its quantification. Percentages of BrdU-positive cells per islet from at least three mice per group are represented. (F) Quantification of the proliferation marker Ki67 in islets from mice treated for 1 and 3 wk. Percentages of Ki67-positive cells per islet from three mice per group are represented. Data information: in (B, E, F), data are represented as mean ± SD. (B, E, F) Statistical significance of differences was examined using one-way, in (B, E), or two-way (in F) ANOVA followed by Tukey’s test. ** and *** indicate P-values below 0.01 and 0.001, respectively. (A, C, D) Scale bars: 100 μm in (A, D), 200 μm in (C).

