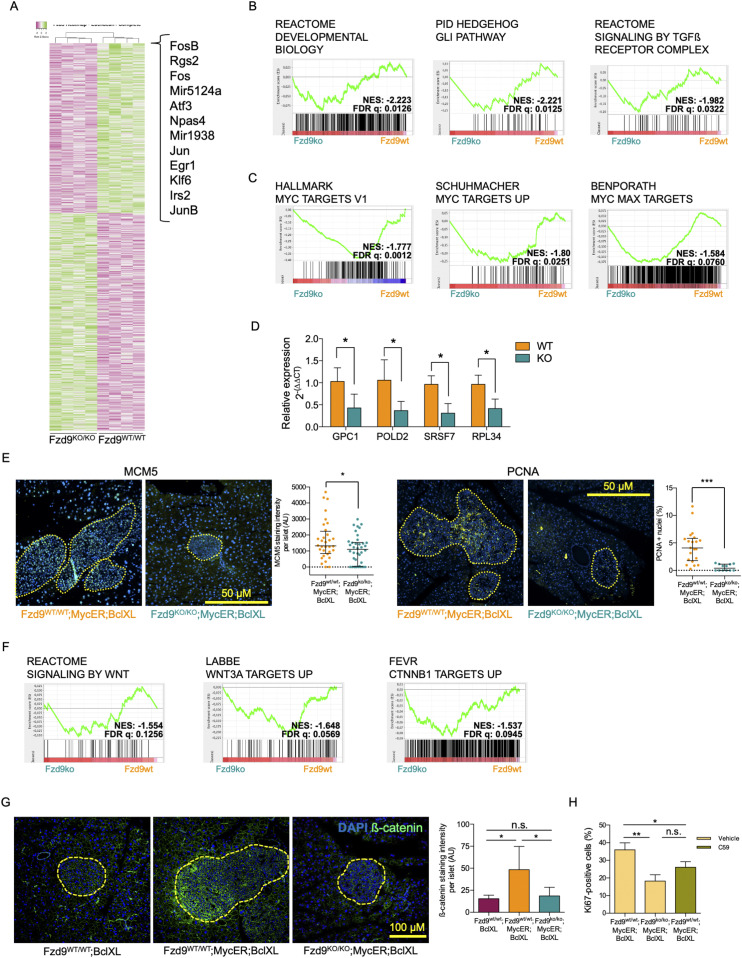
Figure 4. The absence of Fzd9 alters the expression of Myc-related, differentiation and Wnt signaling Gene Sets upon MycER activation.
(A) Heat map of differentially expressed genes determined by microarray analysis performed on a pool of multiple isolated islets (∼20–40) from each of four Fzd9WT/WT;MycER;BclXL mice and four Fzd9KO/KO;MycER;BclXL mice. (B, C) Gene sets related to pancreatic differentiation and (C) Myc targets. (D) qRT-PCR analysis of genes related to Gene Sets shown in (B) (GPC1) and in (C) (POLD2, SRSF7, and RPL34). (E) Immunofluorescence stainings (20×) and quantification of MYC targets MCM5 and PCNA. Total MCM5 intensity and PCNA positive nuclei per islet are shown. (F) Gene sets related to Wnt signaling pathway identified in the Gene Set Enrichment Analysis as differentially expressed when comparing expression profiles. (G) β-catenin detected by immunofluorescence (10×) in pancreatic tissue sections treated with tamoxifen for 3 d and its quantification in the islets. Total β-catenin intensity per islet area is shown. (H) Percentage of Ki67-positive cells in individual islets from Fzd9WT/WT;MycER;BclXL and Fzd9KO/KO;MycER;BclXL after 1 wk of tamoxifen treatment. An additional group of the Fzd9WT/WT;MycER;BclXL mice was pretreated for 2 d with the Wnt inhibitor C59 and then received both C59 + tamoxifen during 1 wk. Data information: in (D, G, H), data are represented as mean ± SD, whereas in (E), as median and interquartile range. (D, E, G) Statistical significance of differences was examined using t test (D), Mann-Whitney U test (E) and Tukey’s test (G). *, ** and *** indicate P-values below 0.05, 0.01 and 0.0001, respectively. (E, G) Scale bars: 50 μm in (E), 100 μm in (G). FDR, false discovery rate; NES, normalized enrichment score.

