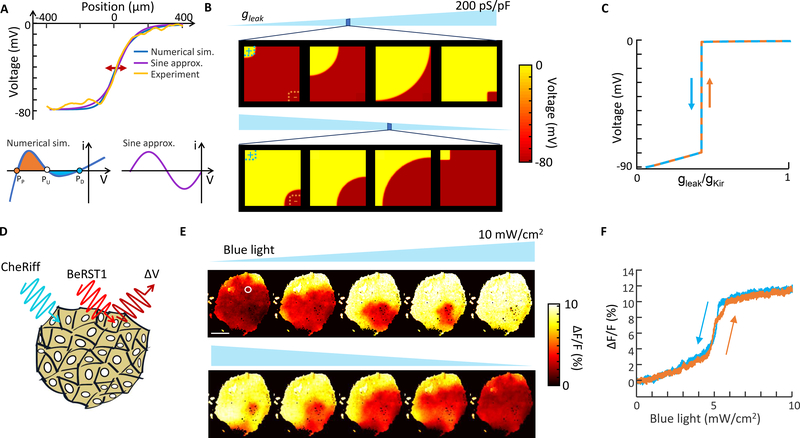
Figure 3. Bioelectric domain walls in an engineered cell line.
A) Top: Profile of a bioelectrical domain wall in one dimension, comparing numerical simulations based on a balanced Kir and leak current, an analytical approximation based on a sinusoidal I-V relation, and experimental data. Bottom: I-V curves based on a detailed biophysical model of Kir + leak (left) or a sinusoidal approximation (right). In a homogeneous tissue, the domain wall migrates in a direction set by the relative areas of the orange and blue shaded regions of the I-V curve, favoring the fixed point with the larger shaded region. B) Simulation of domain wall growth in a homogeneous tissue with two discrete defects to nucleate transitions (clamped at V = 0 on the top left, clamped at V = −90 mV on the bottom right). The transitions in the bulk tissue occurred over a narrow range of gleak. See Supplementary Movie S1. C) Simulation of membrane voltage in the tissue in (B) as a function of leak conductance. D) Confluent islands of bi-HEK cells were illuminated with uniform blue light to stimulate CheRiff, and with red light to elicit voltage-dependent fluorescence of BeRST1. E) Fluorescence images of an island of bi-HEKs under gradually increasing optogenetic stimulation. Scale bar 1 mm. See Supplementary Movies S2 and S3. White circle denotes region with voltage plotted in (F). F) Fluorescence as a function of optogenetic stimulus strength from the region circled in white in (E). Domain wall migration in the large island led to a step-like change in membrane potential without hysteresis.

