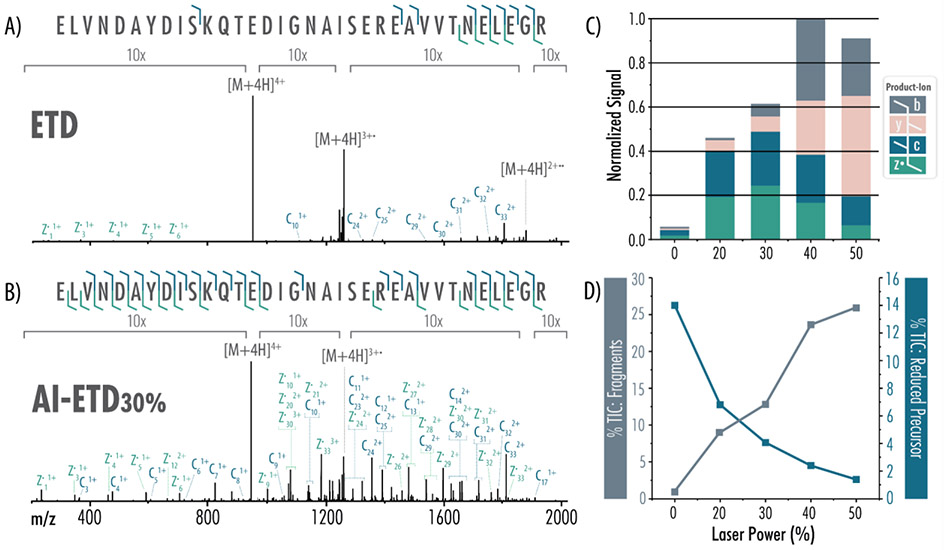
Figure 4. ETD and AI-ETD tandem mass spectra and fragmentation profiles.
Each tandem mass spectrum, representing an average of 25 transients, was generated following 10 ms of A) ETD or B) AI-ETD of the z = 4 peptide precursor. Spectra are on the same intensity scale with labeled regions given a 10x zoom. C) Increasing laser power increases generation of sequence-informative c-, z•-, and y-type product ions over ETD alone. D) AI-ETD drastically improves the percent of the total ion chromatogram (%TIC) explained by product ion fragments (c-, z•-, b-, and y-type) as laser power increases (grey bars, left axis). Additionally, AI-ETD greatly reduces the charge-reduced intact precursor signal, modeled as a percentage of the TIC (blue line, right axis). Laser powers denote the percentage of maximal output and correspond to 0, 20, 32, 44, and 56 W, from left-to-right, respectively. Each graph is normalized to the maximum intensity across all conditions.

