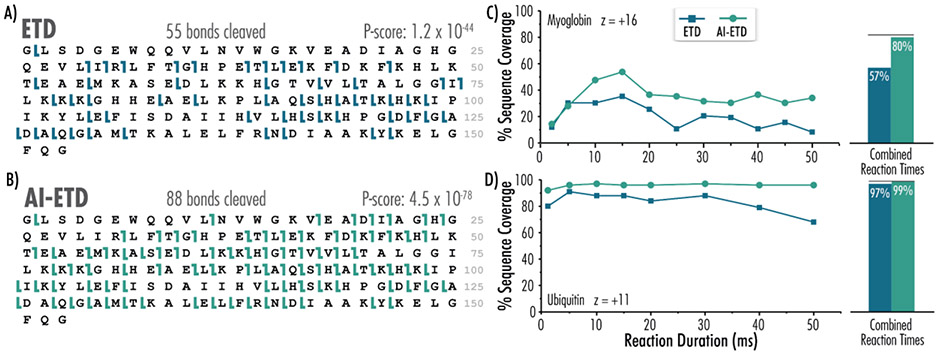
Figure 5. Fiber-enabled AI-ETD outperforms ETD for top-down analyses of myoglobin and ubiquitin.
Myoglobin sequence coverage maps following A) ETD and B) AI-ETD (with ~ 32 W laser output) of the z = 16 precursor ion are shown. AI-ETD (again with ~ 32 W laser output) elicits greater coverage compared to ETD across reactions durations for both C) myoglobin and D) ubiquitin. Black lines above bars indicate sequence coverage when both ETD and AI-ETD data points are included.

