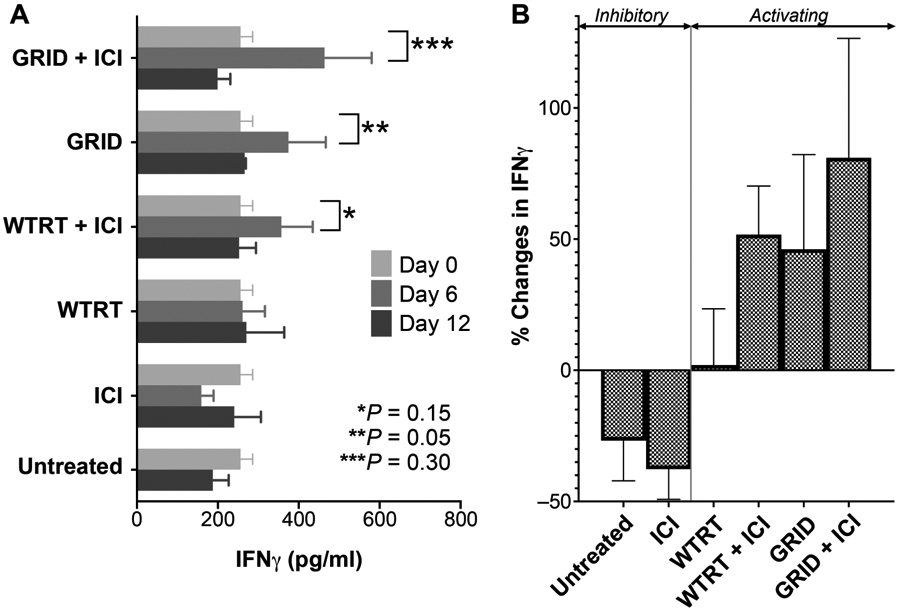
FIG. 6.

Panel A: IFNγ concentration in blood. Each group consisted of serum samples from 5–8 4T1-bearing mice and error bars represent ±1 SEM. Panel B: Collective change in IFNγ concentration from each treatment group at day 6 compared to baseline. Note that untreated mice were measured only at baseline and at day 12
