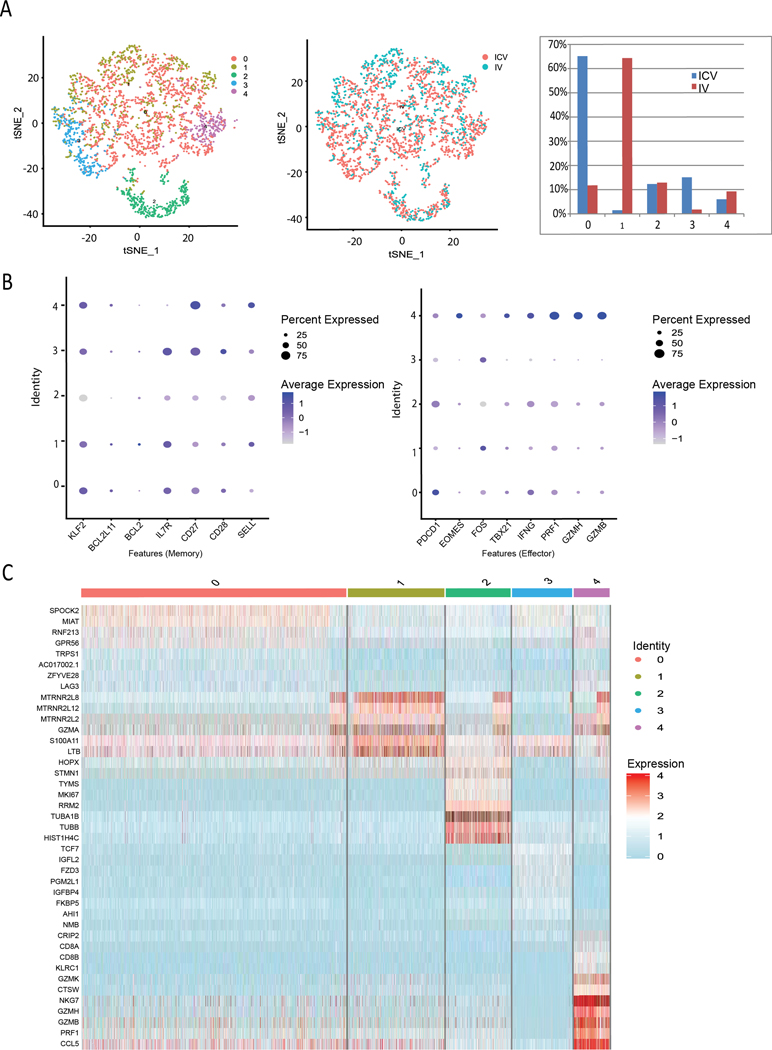
Figure 6. ICV- and IV-delivered CAR T cells that persist in vivo have distinct gene signatures.

T cells were harvested from the bone marrow of mice 68 days post ICV or IV CAR T cell infusion and the samples from one mouse in each group were subjected to single cell RNA-seq (scRNA-seq) analysis. The subsequent analysis of human gene data was performed using “Seurat” package v3.0 and R scripts. (A) t-distributed stochastic neighbor embedding (tSNE) visualization plot of scRNA-seq data and (B) dot plots and feature plots in the identified cell clusters were generated for specific T cell populations. ICV delivered cells were enriched in cluster 3, while IV delivered cells were enriched in cluster 1. (C) Cluster specific markers were identified to generate a heatmap.
