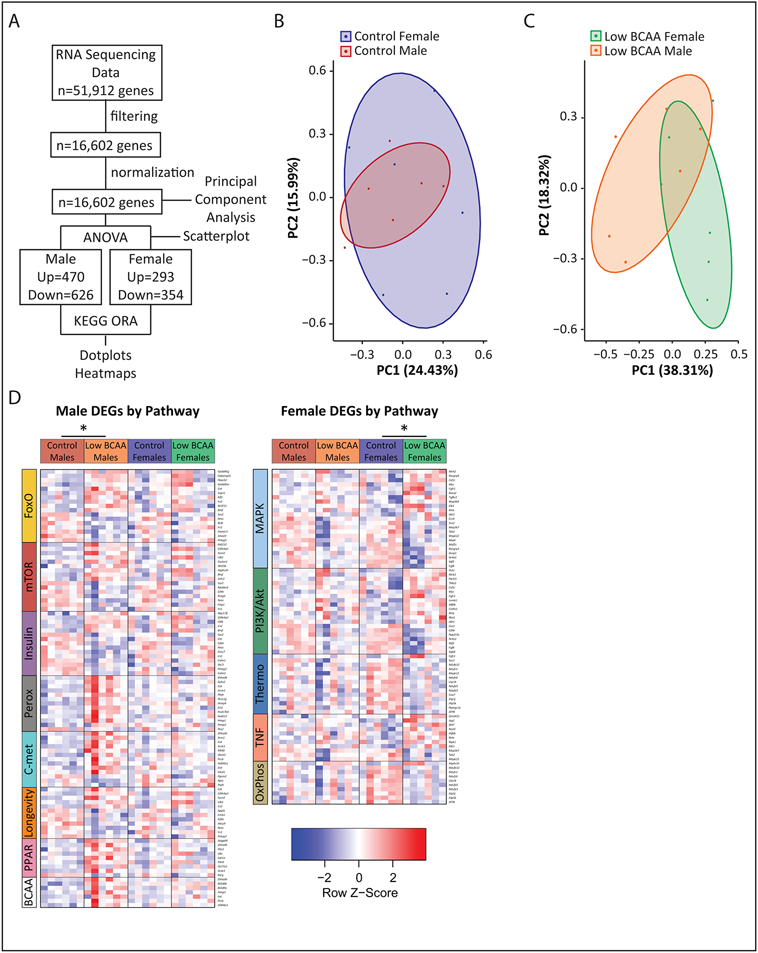
Extended Data Fig. 4. Transcriptional profiling of skeletal muscle.
Transcriptional profiling was performed on mRNA from the skeletal muscle of male and female mice that consumed either Control or Low BCAA diets from weaning until 16 months of age (N = 6 biologically independent animals for all groups; Tables S13-S14). (A) Workflow from raw RNA sequencing reads through data analysis and data representation. (B-C) Principal component analysis for (B) Control and (C) Low BCAA fed groups. (D) Heatmaps of differentially expressed genes by mouse from significant KEGG over-representation analysis (ORA) pathways of interest identified in Tables S13B, S14B. DEGs were identified using an empirical Bayes moderated linear model. *Two-sided P values adjusted with the Benjamini–Hochberg procedure ORA was performed on DEGs (designated by an adjusted P value of 0.3 for female and 0.2 for male contrasts) using a one-sided hypergeometric test, and P values were adjusted using the Benjamini–Hochberg procedure.

