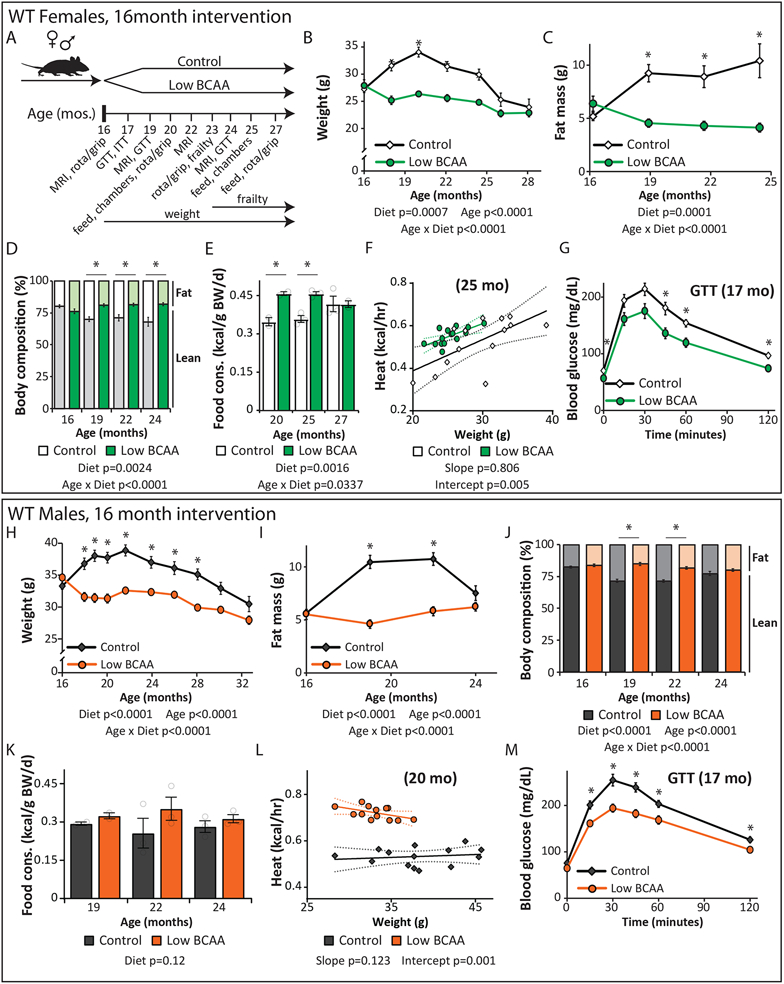
Figure 2: A Low BCAA diet promotes the metabolic health of aged mice.
(A) Female and male C57BL/6J.Nia mice were fed Control or Low BCAA diets beginning at 16 months of age, schematic relevant to Figures 2-3 and Supplementary Tables 1 and 2. (B-G) Female C57BL/6J.Nia mice were fed the indicated diets beginning at 16 months of age. (B) The weight of the mice was tracked starting at 16 months of age (n varies by month; maximum N; Control = 20, Low BCAA = 19 biologically independent animals; * p < 0.05 (p-values by month of age: 18 mo. < 0.0001, 20 mo. < 0.0001, 22 mo. = 0.0016, 24.5 mo. = 0.0222). (C-D) The (C) fat mass and (D) body composition of a subset of mice was tracked (n varies by month; maximum N = 10 biologically independent animals for both groups; * p < 0.05 (p-values for (C) by month of age: 19 mo. = 0.0007, 21.5 mo. = 0.0052, 24.5 mo. = 0.016; p-values for (D) by month of age: 19 mo. = 0.0005, 21.5 mo. = 0.0134, 24.5 mo. = 0.0193). (E) Food consumption over time (maximum N = 3 independent cages for both groups; * p < 0.05 (p-values by month of age: 20 mo. = 0.0141, 25 mo. = 0.0082). (F) Energy expenditure (Heat) was assessed using metabolic chambers at 25 months of age (N; Control = 15, Low BCAA = 15 biologically independent animals). (G) Glucose tolerance test after three weeks of diet feeding (N; Control = 19, Low BCAA = 20 biologically independent animals; * p < 0.05; p-values by time: 0m = 0.0369, 45m = 0.0118, 60m = 0.0066, 120m = 0.0005). (H-M) Male C57BL/6J.Nia mice were fed the indicated diets beginning at 16 months of age. (H) The weight of the mice was tracked starting at 16 months of age (n varies by month; maximum N = 20 biologically independent animals for both groups; * p < 0.05, p-values by month of age: 18 mo. = 0.0005, 19-21.5 mo. <0.0001, 24 mo. = 0.0023, 26 mo. = 0.0073, 28 mo. = 0.0251). (I-J) The (I) fat mass and (J) body composition of a subset of mice was tracked (n varies by month; maximum N = 20 biologically independent animals for both groups; * p < 0.05 (p-values for (I) by month of age: 19-22 mo. < 0.0001; p-values for (J) by month of age: 19-22 mo. < 0.0001). (K) Food consumption of mice over time (maximum N = 3 independent cages for both groups). (L) Energy expenditure (Heat) was assessed using metabolic chambers at 20 months of age (N; Control = 14, Low BCAA = 13 biologically independent animals). (M) Glucose tolerance test after three weeks of diet feeding (N = 20 biologically independent animals for both groups; * p < 0.05, p-values by time: 15m = 0.0034, 30m = 0.0019, 45m = 0.0006, 60m = 0.0279, 120m = 0.0469). (B-E, H-K) Statistics for the overall effects of diet, age, and the interaction represent the p value from a mixed-effects model (restricted maximum likelihood [REML]) or two-way repeated measures ANOVA, multiple comparisons by two-sided Sidak’s post-test. (F, L) Energy expenditure data was analyzed by linear regression of energy expenditure by body weight (ANCOVA). (G, M) two-way repeated measures ANOVA, multiple comparisons by two-sided Sidak’s post-test. Data are represented as mean ± SEM.

