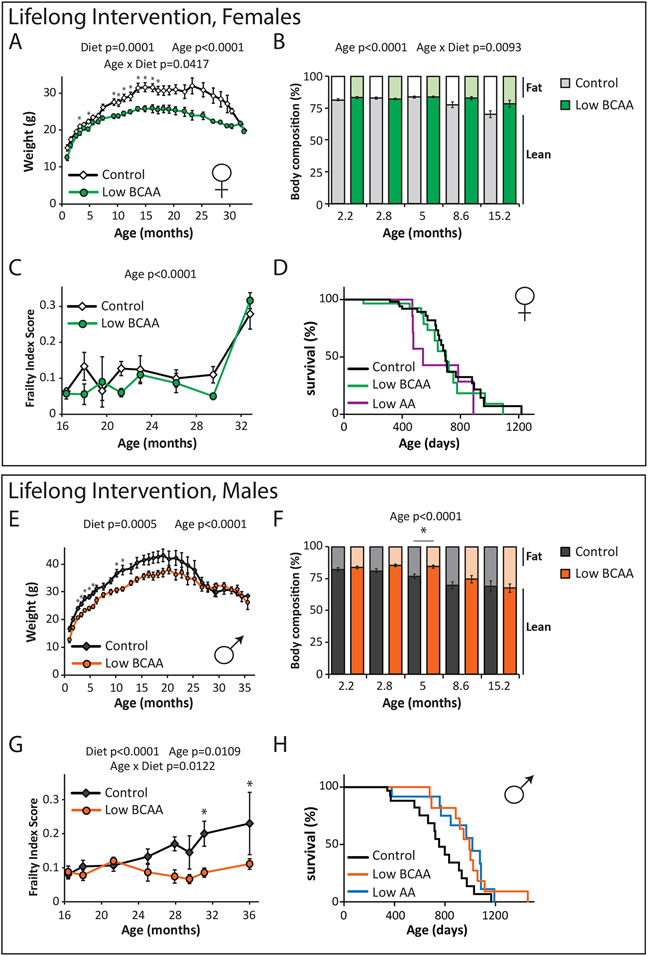
Figure 5: Lifelong consumption of a Low BCAA diet promotes healthspan and extends male lifespan.
Wild-type female (A-E) and male (F-J) mice were placed on either Control or Low BCAA diets at weaning. (A) The weight of the female mice was tracked longitudinally (n varies by month, maximum N; Control = 35, Low BCAA = 22 biologically independent animals; * p < 0.05, adjusted p-values by month of age: 3.25 mo. = 0.0015, 4.75 mo. = 0.0136, 9.5 mo. = 0.0102, 10 mo. = 0.0341, 11 mo. = 0.0065, 12.25 mo. = 0.0393, 13.5 mo. = 0.0047, 15 mo. = 0.0057, 16.25 mo. = 0.0150, 17.25 mo. = 0.0323). (B) Female body composition (n varies by month, maximum N; Control = 15, Low BCAA = 12 biologically independent animals). (C) Female frailty was assessed longitudinally starting at 16 months of age (n varies by month, maximum N; Control = 25, Low BCAA = 18 biologically independent animals); average frailty by index measured can be found in Table S9. (D) Kaplan-Meier plot showing the survival of females fed the indicated diets from weaning (N; Control = 60, Low BCAA = 29, Low AA = 9 biologically independent animals, Table S10). (E) The weight of the male mice was tracked longitudinally (n varies by month, maximum N; Control = 22, Low BCAA = 23 biologically independent animals; * p < 0.05, adjusted p-values by month of age: 2.5 mo. = 0.0014, 3.25 mo. = 0.0190, 4 mo. = 0.0014, 4.75 mo. = 0.0028, 5.5 mo. = 0.0005, 10 mo. = 0.025, 11.25 mo. = 0.0283). (F) Male body composition, (n varies by month, maximum N; Control = 19, Low BCAA = 18 biologically independent animals; *p = 0.0154). (G) Male frailty was assessed longitudinally starting at 16 months of age (n varies by month, maximum N = 13 biologically independent animals for both groups; * p < 0.05, adjusted p-values by month of age: 31 mo. = 0.0409, 36 mo. = 0.0199); average frailty by index measured can be found in Table S11. (H) Kaplan Meier plot showing the survival of males fed the indicated diets from weaning (N; Control = 54, Low BCAA = 30, Low AA = 21 biologically independent animals, Table S10). (A-C, E-G) Statistics for the overall effects of diet, age, and the interaction represent the p value from a mixed-effects model (restricted maximum likelihood [REML]) or two-way repeated measures ANOVA, multiple comparisons by two-sided Sidak’s post-test. Data are represented as mean ± SEM.

