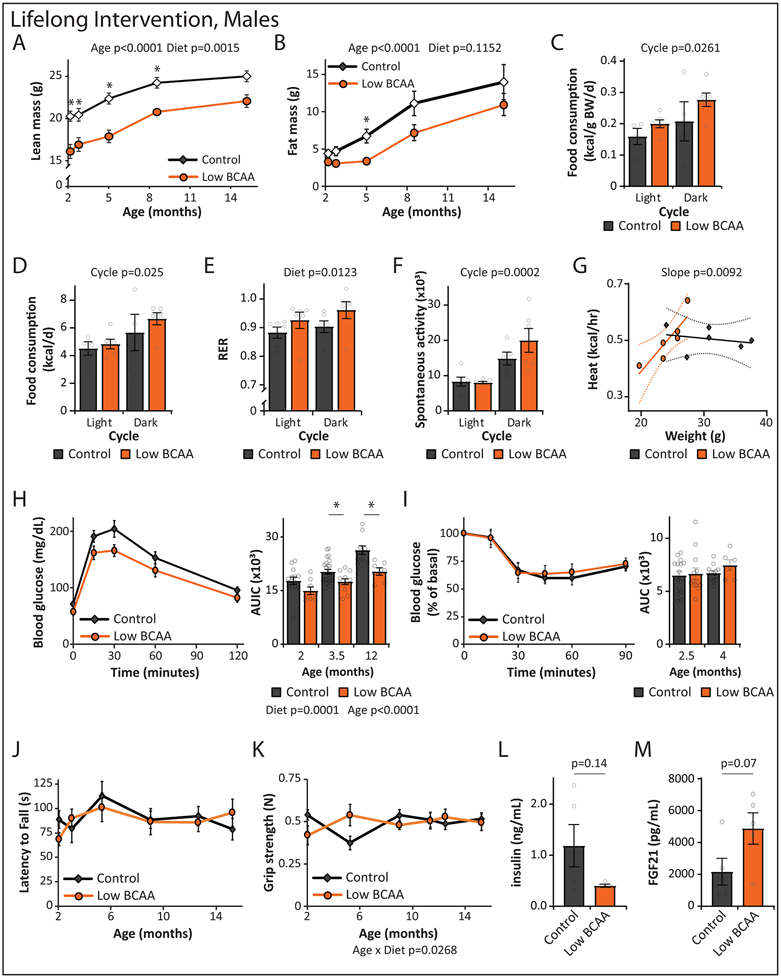
Extended Data Fig. 3. Effects of a lifelong Low BCAA diet on the healthspan of male mice.
(A-M), Wild-type male mice were placed on either Control or Low BCAA diets at weaning. The (A) lean mass and (B) fat mass of a subset of mice was tracked (n varies by month, maximum N; Control = 11, Low BCAA = 8 biologically independent animals; * p < 0.05 (p-values for (A) by month of age: 2 mo. = 0.0028, 2.75 mo. = 0.0194, 5 mo. = 0.0011, 8.5 mo. = 0.0246; for (B) * p = 0.0095). Food consumption (N; Control = 4, Low BCAA = 6 biologically independent animals), was calculated (C) per gram of body weight and (D) by animal. (E) Respiratory exchange ratio, (F) ambulatory movement, and (G) energy expenditure (heat) were assessed using metabolic chambers at 5 months of age (E-G; N = 6 biologically independent animals for both groups). (H) Glucose tolerance test at 2 months of age (N; Control = 14, Low BCAA = 8 biologically independent animals), and corresponding area under the curve (AUC), also from tests performed at 3.5 and 12 months of age (maximum N; Control = 23, Low BCAA = 12 biologically independent animals; * p < 0.05 (p-values by month of age: 3.5 mo. = 0.0379, 12 mo. = 0.0054). (I) Insulin tolerance test at 2.5 months of age (N; Control = 15, Low BCAA = 13 biologically independent animals), and corresponding area under the curve, also from a test at 4 months of age (maximum N; Control = 15, Low BCAA = 13 biologically independent animals). (J) Rotarod performance (n varies by month, maximum N; Control = 15, Low BCAA = 12 biologically independent animals) and (K) grip strength (n varies by month, maximum N; Control = 12, Low BCAA = 8 biologically independent animals) were assessed longitudinally. Levels of (L) insulin and (M) fibroblast growth factor 21 (FGF21) were measured in serum by ELISA (16 months of age; N; Control = 5, Low BCAA = 4 biologically independent animals per group). (A-M) Statistics for the overall effects of diet, age, and the interaction represent the p value from a mixed-effects model (restricted maximum likelihood [REML]), two-way repeated measures ANOVA, or a two-tailed, unpaired t-test in (L-M); multiple comparisons by two-sided Sidak’s post-test. Data are represented as mean ± SEM.

