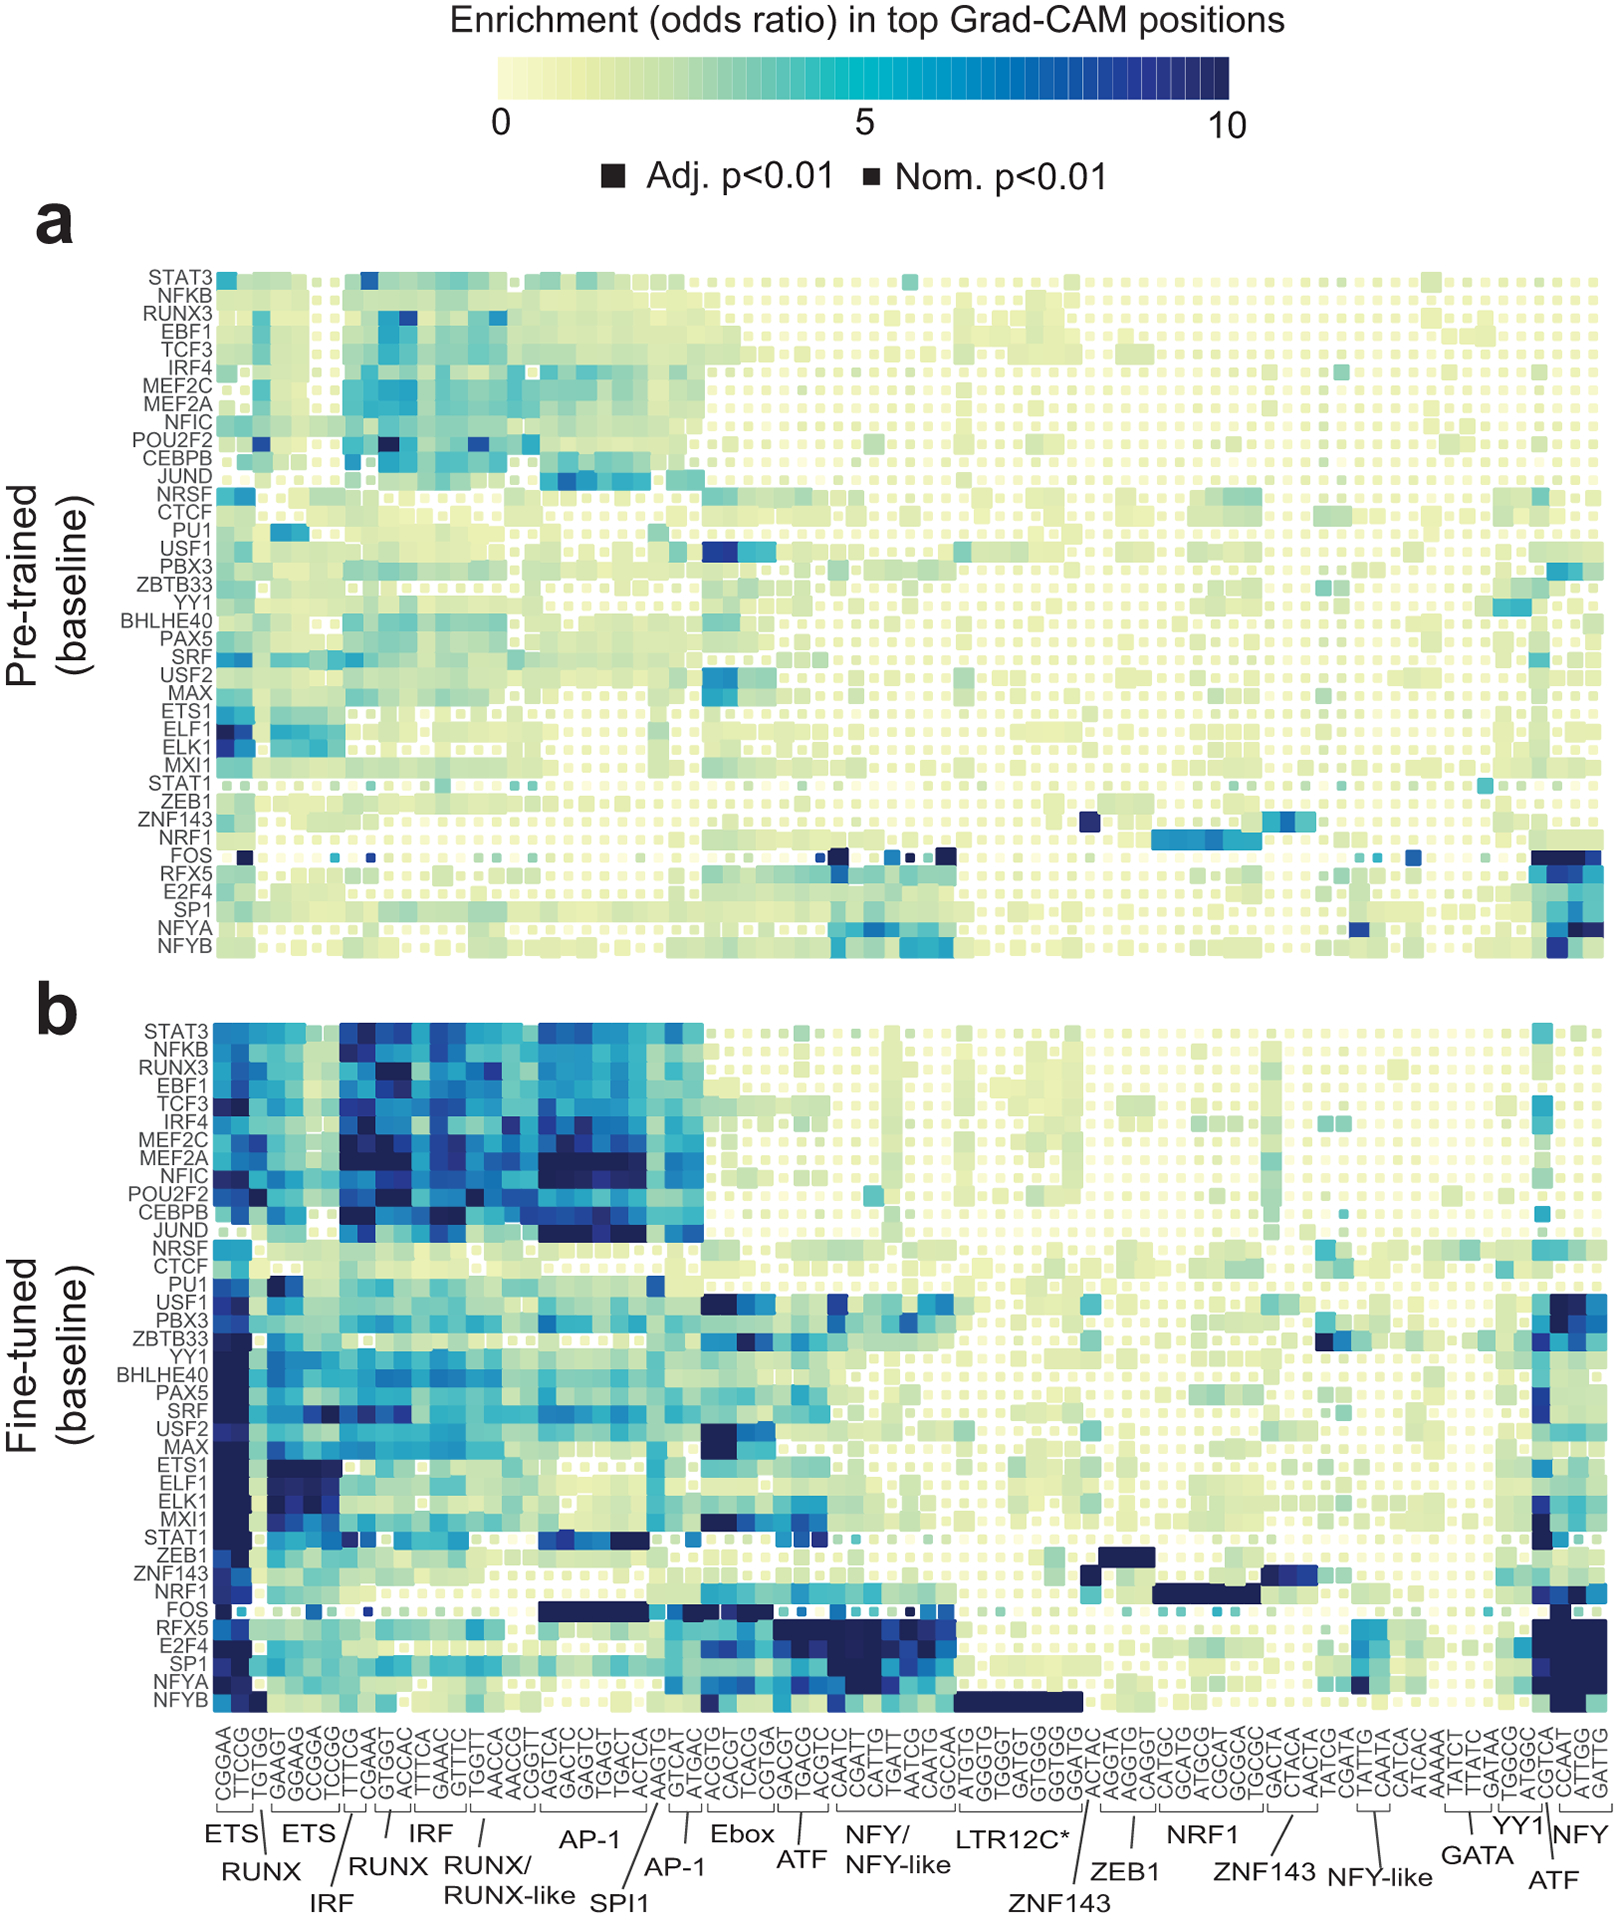
Extended Data Fig. 3. Comparing key context sequence features identified in pre-trained vs. fine-tuned models.

The heatmap shows the enrichment of each 5-mer in regions with the highest Grad-CAM scores for each TF using baseline models before (a) and after (b) fine-tuning. Rows and columns are ordered the same as in Fig. 3. Colors denote odds ratios and the sizes of the boxes denote statistical significance as in Fig. 3. Panel (b) is reproduced from Fig. 3a for comparison
