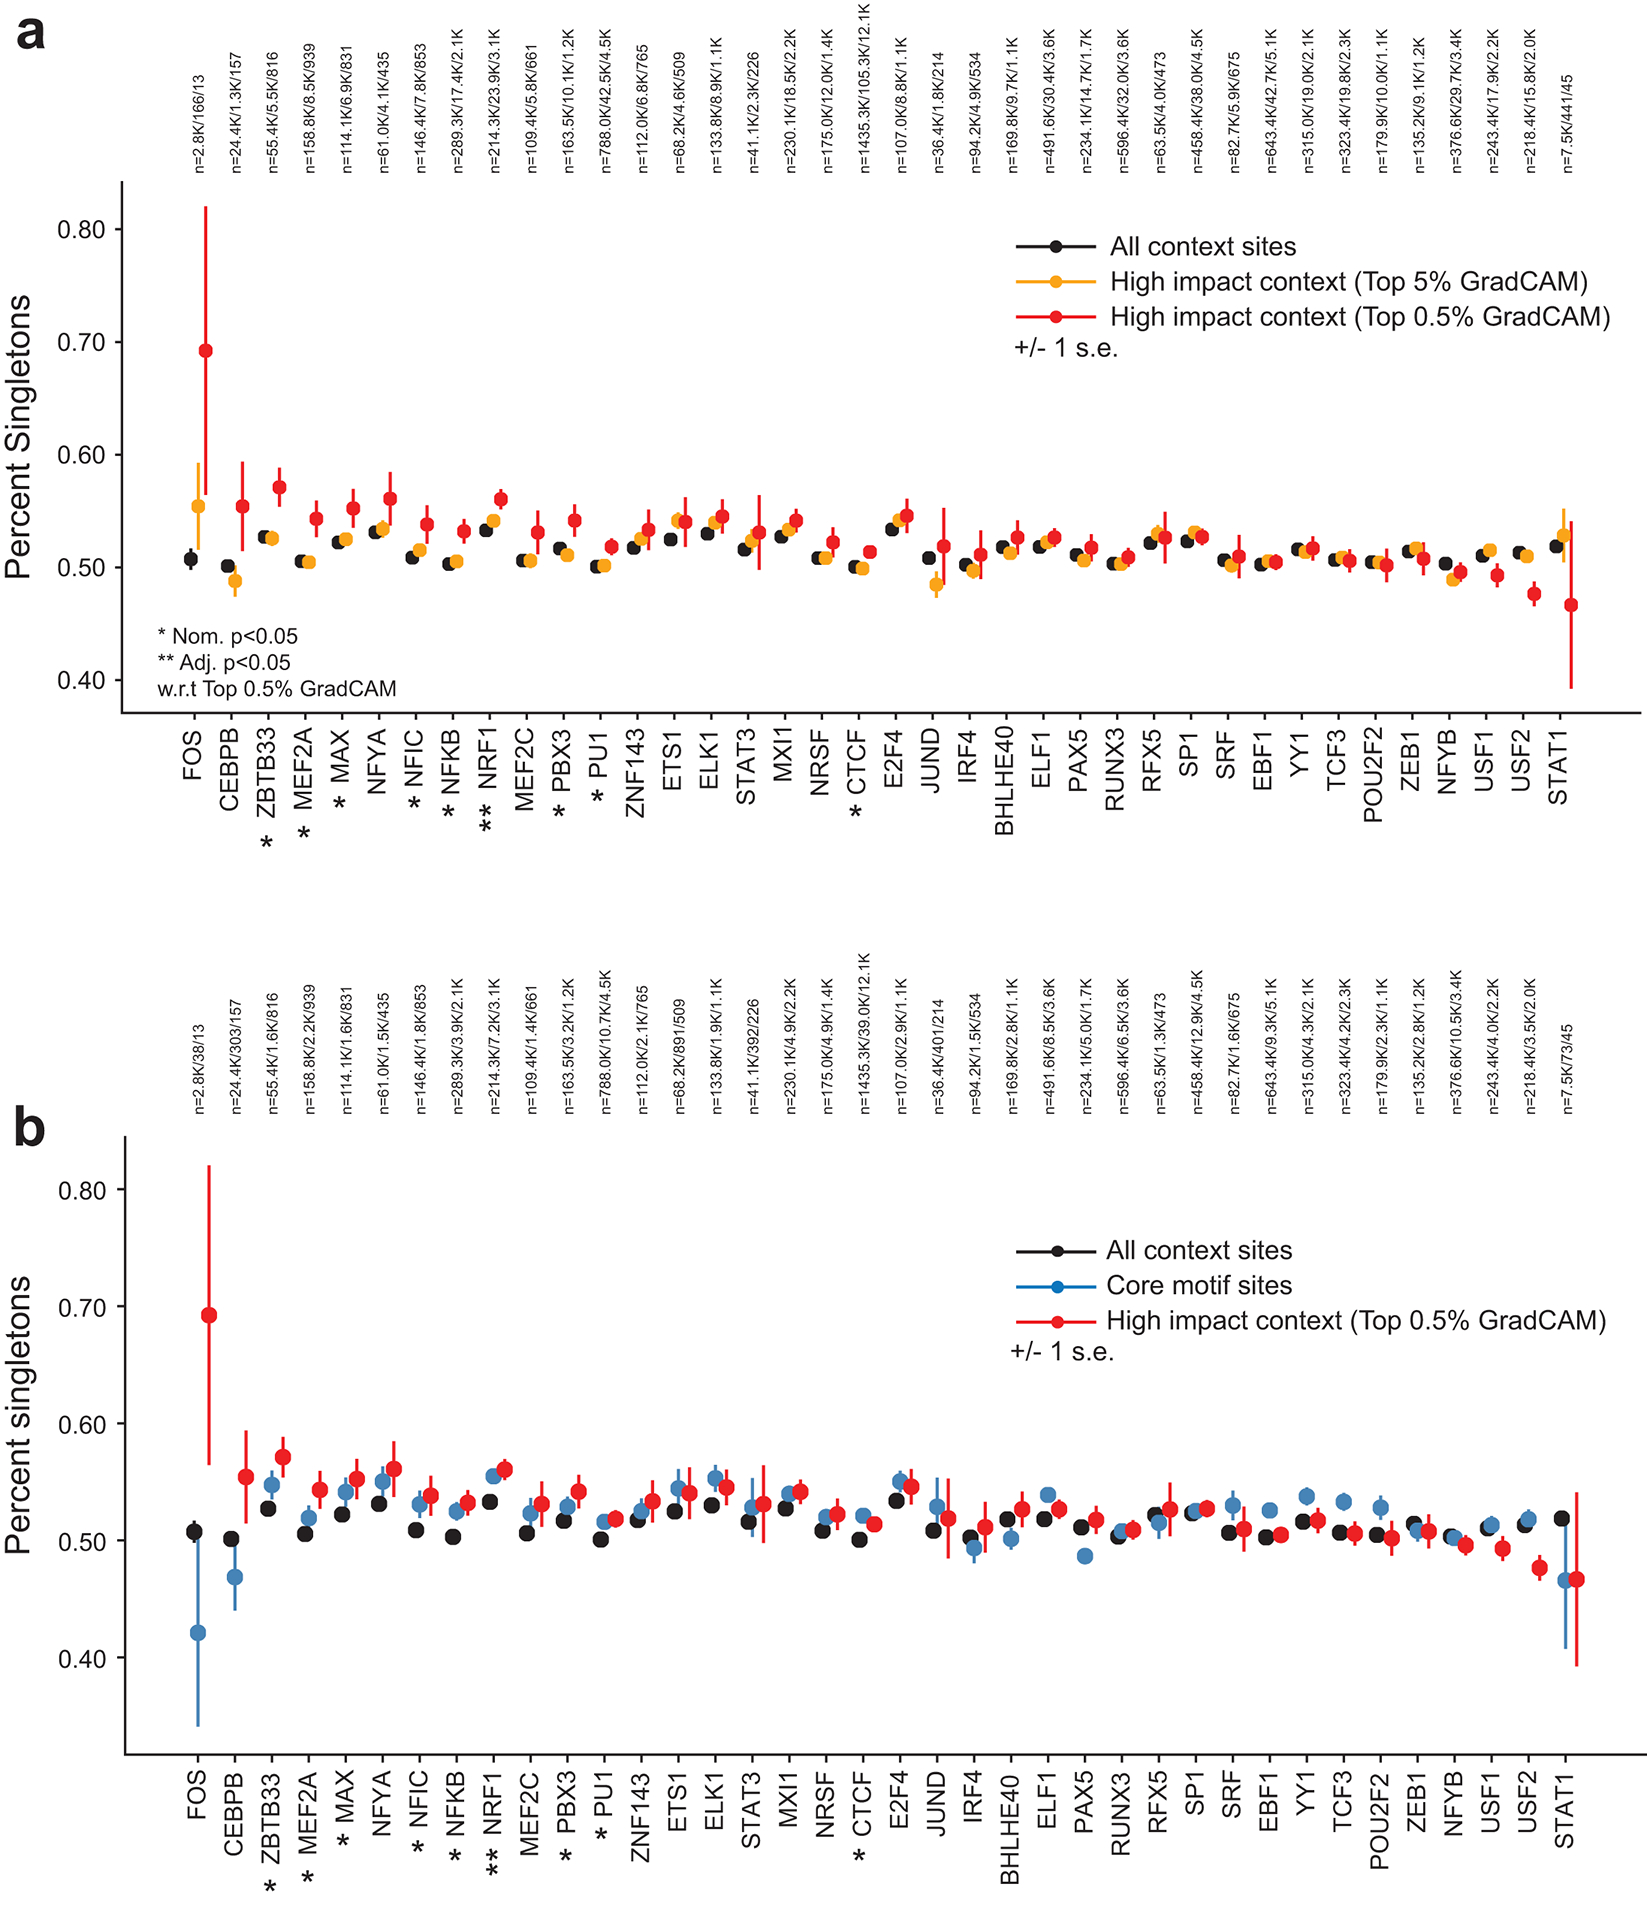
Extended Data Fig. 5. Singleton rate of context SNPs vs. core motif regions. (a) Singleton rate of context SNPs.

The plot shows the percent of SNPs in each category that are singletons. Black=all context sites, orange=context sites with top 5% Grad-CAM scores, red=context sites with top 0.5% Grad-CAM scores. Error bars show +/− 1 s.e. (b) is the same as (a), but additionally shows singleton rates for SNPs in core motif regions (blue). The number of SNPs in each category for each TF is annotated above each plot.
