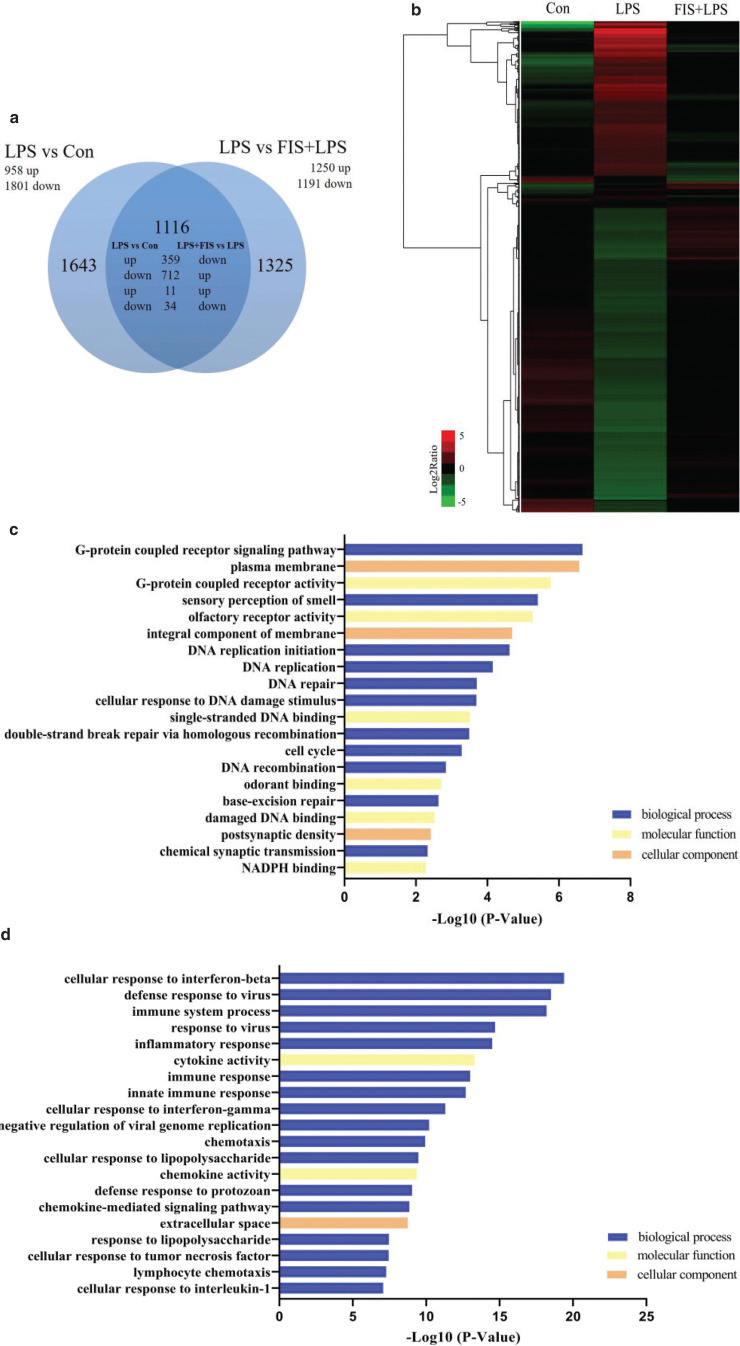
Fig. 2.
Microarray analysis of genes targeted by fisetin in LPS-treated RAW264.7 cells. (a) Venn diagram of the number of DEGs in LPS versus Con and LPS versus FIS+LPS; (b) hierarchical clustering of genes targeted by fisetin in LPS-treated RAW264.7 cells; (c) GO enrichment analysis of genes down-regulated in LPS versus Con and up-regulated in FIS+LPS versus LPS, and (d) genes up-regulated in LPS versus Con and down-regulated in FIS+LPS versus LPS. The GO terms were sorted by –Log10 of the enrichment P-value.

