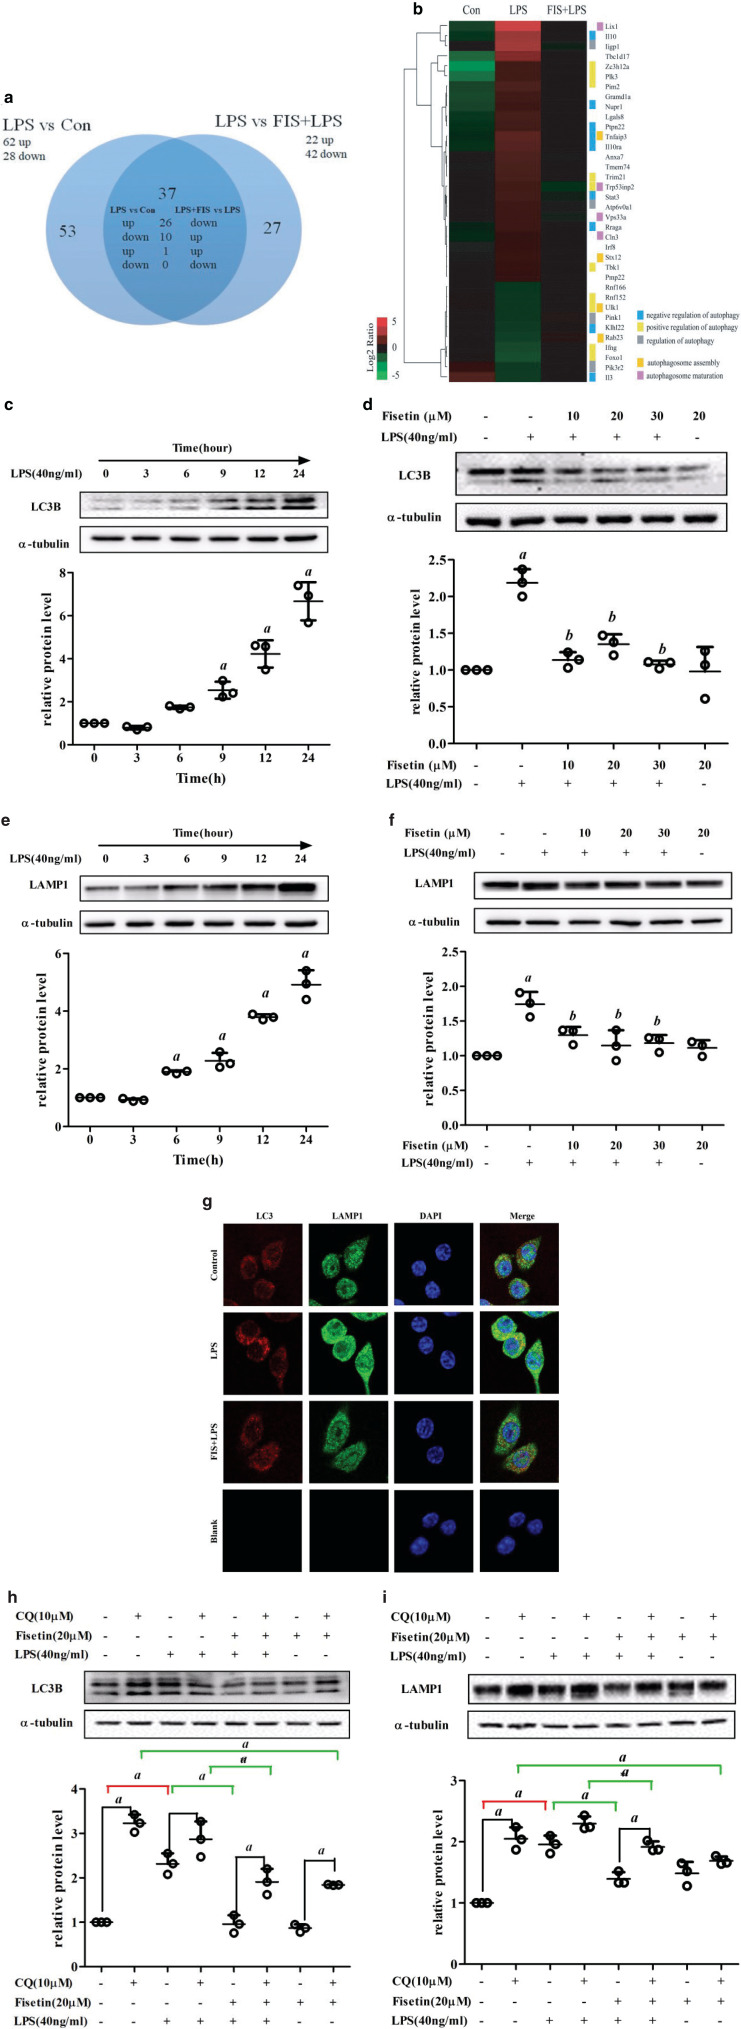
Fig. 4.
Effect of fisetin on autophagy in LPS-treated RAW264.7 cells. (a) Venn diagram of the DEGs annotated as the terms associated with autophagy. (b) Hierarchical clustering of the DEGs associated with autophagy. Log2 ratio was calculated based on log2 transformed output and input signals. Data were median center across gene, and Euclidean distance and the complete linkage method were used for clustering. (c) LC3B and (e) LAMP1 protein levels in cells exposed to LPS for different time periods (0, 3, 6, 9, 12, and 24 h); (d) LC3B and (f) LAMP1 protein levels in the control group, the LPS (40 ng/mL) group, the fisetin (10, 20 and 30 μM) and LPS (40 ng/mL) co-treatment group, and the fisetin (20 μM) group. a < 0.05 versus control group; b < 0.05 versus LPS group; (g) immunofluorescence of LC3 and LAMP1 in the control group (Control), the LPS group (LPS), the fisetin (20 μM) and LPS co-treatment group (FIS+LPS), and the negative control group (Blank); (h) LC3B and (i) LAMP1 protein levels in cells pretreated with CQ. a < 0.05. Data are represented as mean ± SD (n = 3).

