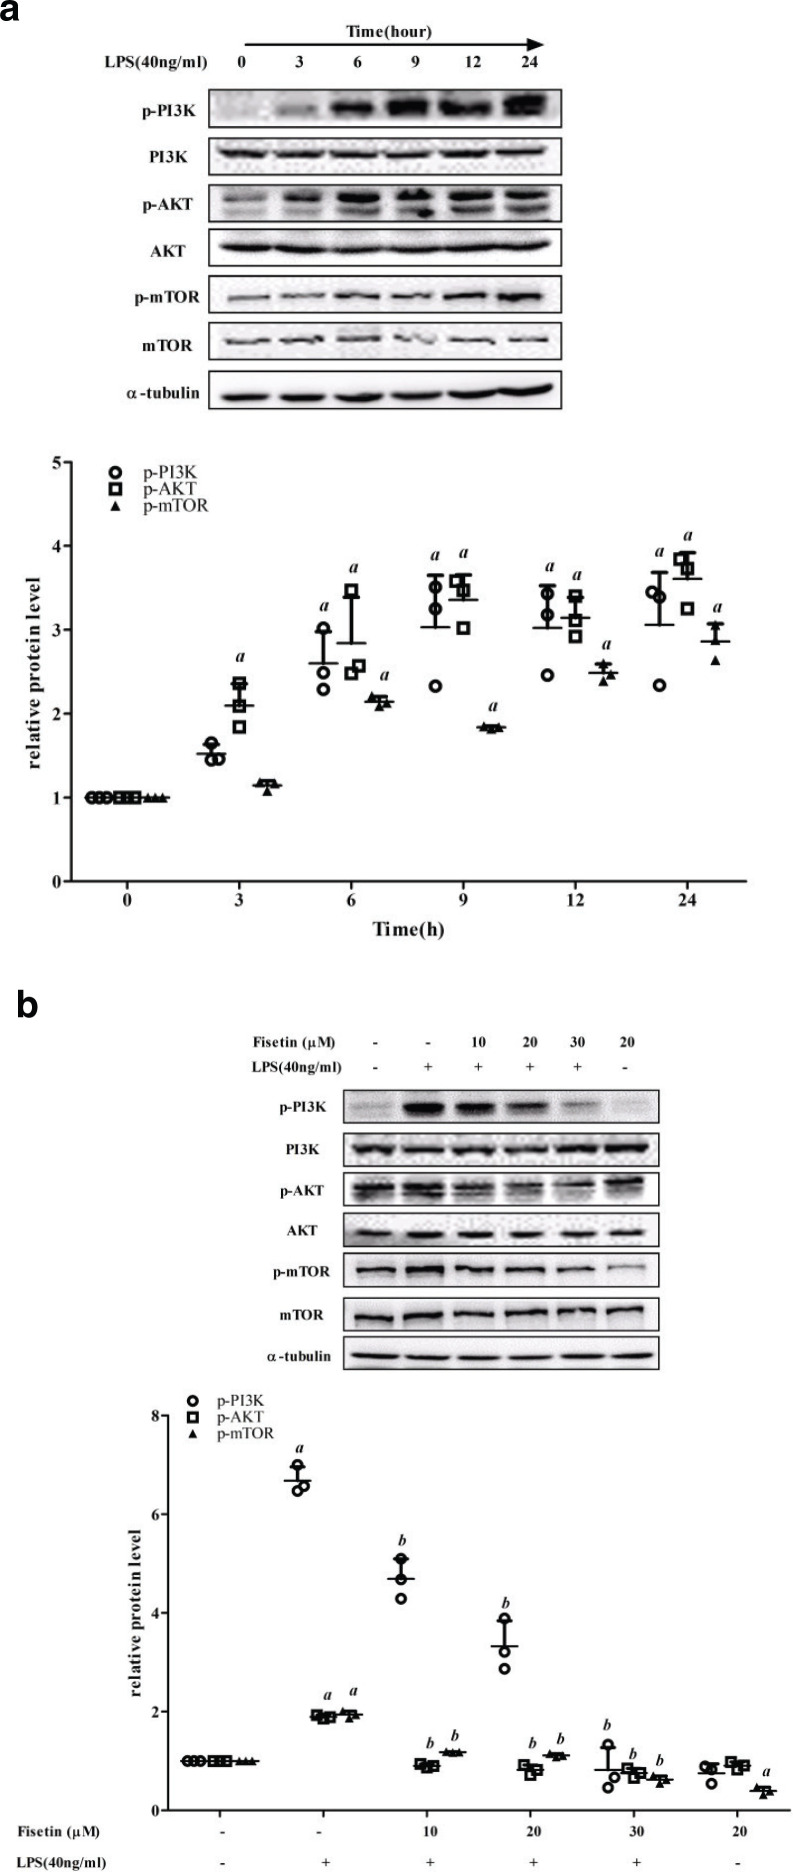
Fig. 5.
Effect of fisetin on the PI3K/AKT/mTOR signaling pathway. (a) The protein levels of p-PI3K, p-AKT and p-mTOR in cells exposed to LPS for different time periods (0, 3, 6, 9, 12, and 24 h). (b) The protein levels of p-PI3K, p-AKT and p-mTOR levels in the control group, the LPS (40 ng/mL) group, the fisetin (10, 20 and 30 μM) and LPS (40 ng/mL) co-treatment group, and the fisetin (20 μM) group. Data are represented as mean ± SD (n = 3). a < 0.05 versus control group; b < 0.05 versus LPS group.

