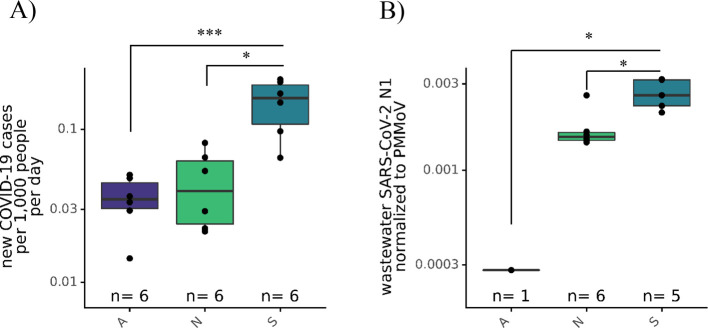
Figure 2.
(A) New COVID-19 clinical cases per day per 100,000 population in three areas served by the distinct A, N, and S wastewater interceptors over 6 days from 7/15 to 7/21. “n” represents the number of days during which clinical case data were collected. (B) Comparison of SARS-CoV-2 N1 assay represented as SARS-CoV-2 gene copies per liter normalized to PMMoV gene copies per liter between interceptors serving the A, N, and S East Bay areas. “n” represents the number of biological replicates (the wastewater was collected on a single day in the 6-day window). The Kruskal-Wallis test followed by Dunn’s test was performed to determine significance, where * = p < 0.05 and *** = p < 0.001.

