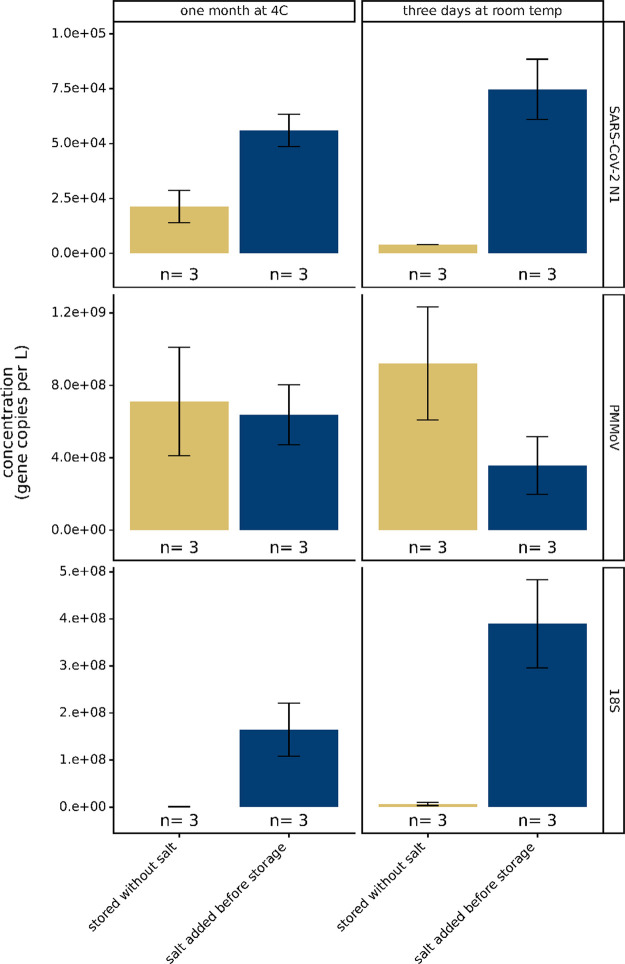
Figure 3.
Effect of lysis salt addition prior to wastewater storage on SARS-CoV-2 N1, PMMoV, and 18S rRNA assay signals. “n” represents the number of storage and extraction biological replicates per condition. Bars are plotted at the arithmetic mean of biological triplicates and error bars represent the variation associated with biological triplicates as quantified by the arithmetic standard deviation of the biological triplicates.

