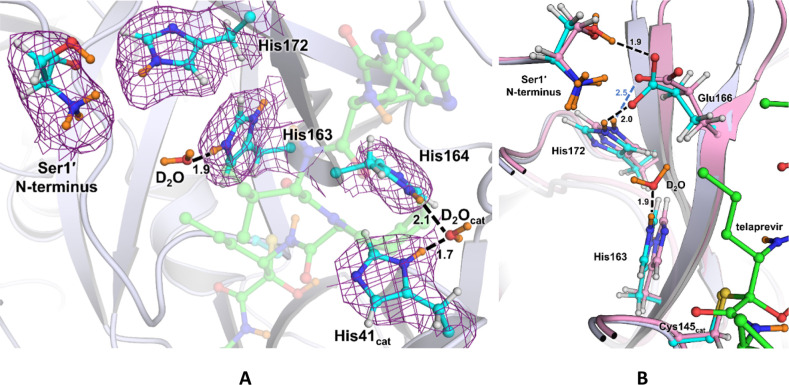
Figure 3.
(A) Ionizable residues of the active site and the S1 subsite of the Mpro–telaprevir complex. A 2FO – FC nuclear density map of the Ser1′ N-terminus and histidines 41, 163, 164, and 172 is shown contoured at 1.0 σ level (violet mesh). All distances are shown in Å with telaprevir (green carbon atoms) being transparent for clarity. (B) Superposition of Mpro–telaprevir (cyan carbon atoms) and apo-Mpro (pink carbon atoms, PDB ID 7JUN) neutron structures showing the S1 subsite. Distances are in Å.

