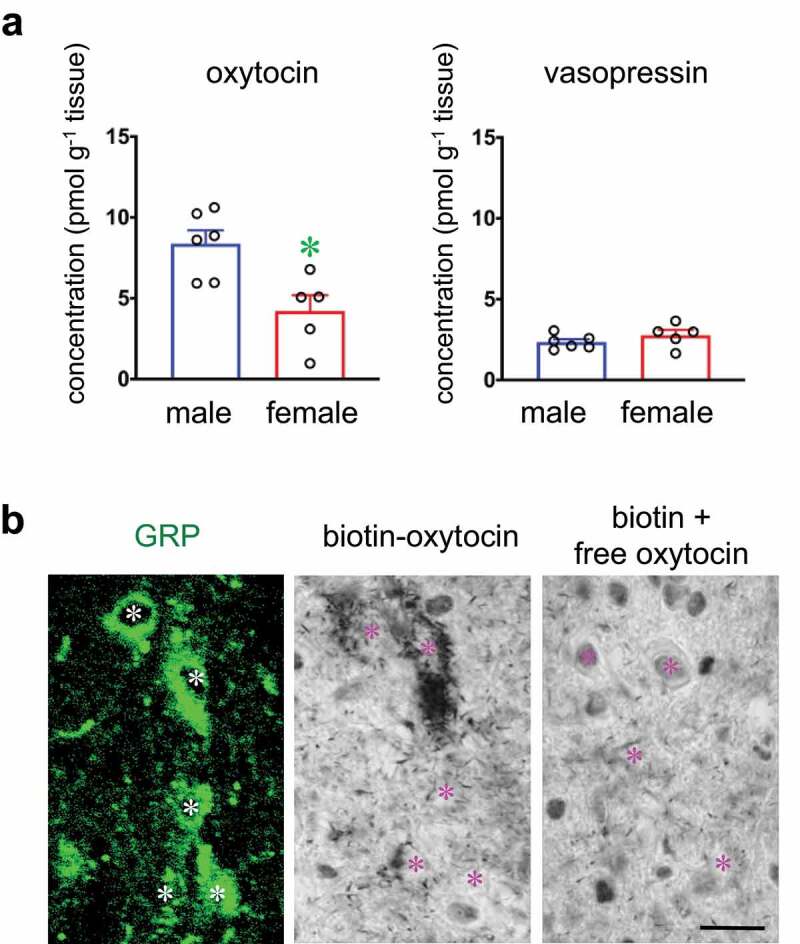
Figure 2.

(a) Local concentrations of oxytocin and vasopressin in the lumbar spinal cord. [Data are presented as mean ± SEM (highlight) and individual point (black). Student’s unpaired t test; oxytocin, t9 = 3.25, *P < 0.05; vasopressin, t9 = 1.19, P = 0.133, male rats (n = 6), female rats (n = 5).] (b) Oxytocin-binding is apparent in the spinal GRP neurons (green). Left panel indicates the GRP+ neuronal cell bodies (green). Middle panel shows that oxytocin-binding is detected in the cytoplasm (chromogen aggregates) of GRP+ neuronal cell bodies. Right panel indicates the negative control sections incubated with biotinylated oxytocin and excess free oxytocin. Asterisks indicate the location of neuronal nuclei expressing GRP and oxytocin-binding double-positive neurons or binding-negative neurons (control). Scale bar: 20 µm
