Figure 4.
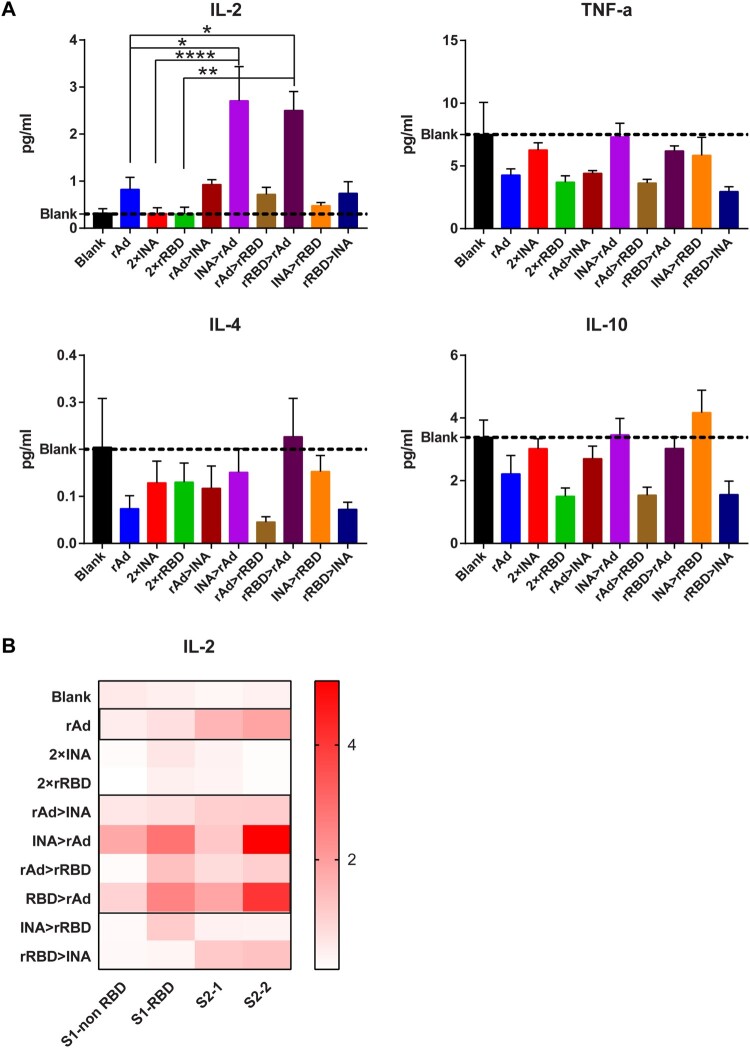
Multiplex cytokine analysis for different immunization regimens. Isolated lymphocytes in 9 regimens identified in Figure 1 were stimulated with 4 spike peptide pools. Supernatants pooled by different groups (A) or different peptide pools (B) were collected. IL-2, IL-4, IL-10 and TNF-α levels in supernatants were measured by MSD; the concentration of each cytokine(pg/mL) is represented by histogram (A) or heatmap (B) (n = 6 per group). Bars represent means ± SEM, *p < 0.05, **p < 0.01, ****p < 0.0001.

