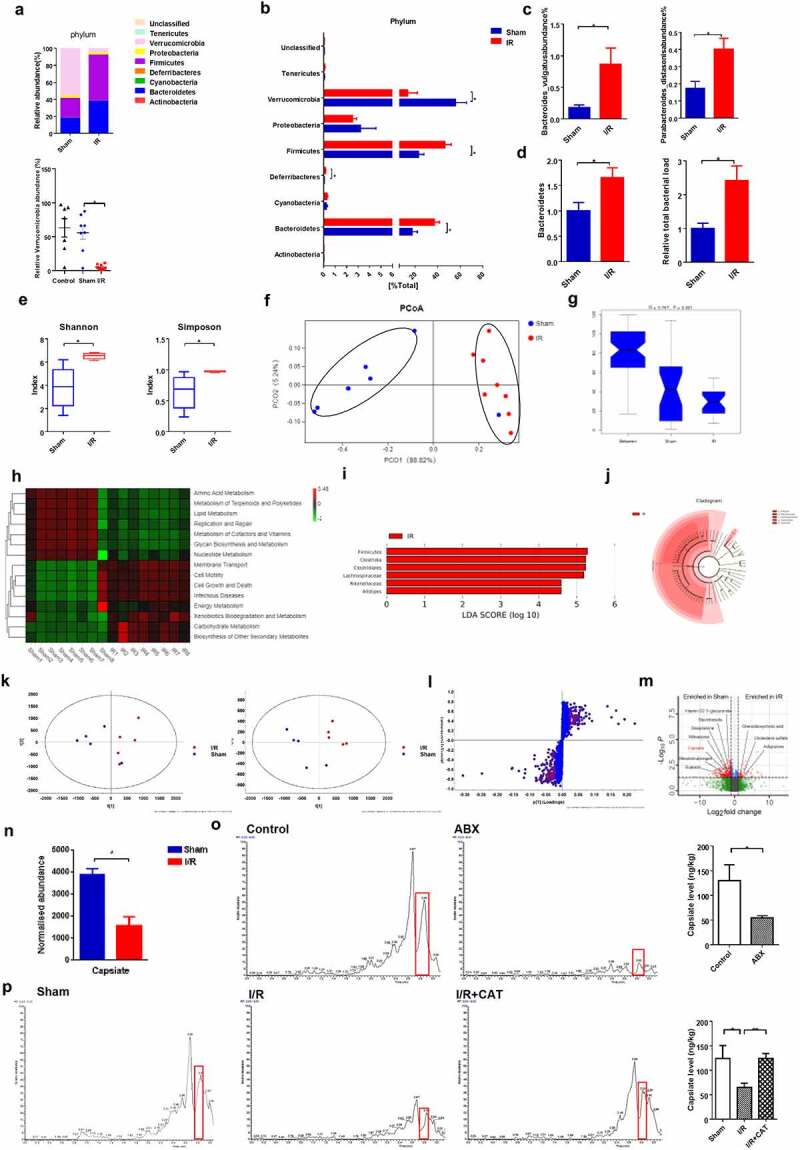
Figure 3.

Intestinal I/R-induced changes in the gut microbiota and its metabolites. (a-b) Relative bacterial abundance at the phyla level in the cecum of mice. (c) Relative abundance of Bacteroides vulgatus and Parabacteroides distasonis at the species level in the cecum. (d) Relative amounts of Bacteroidetes and total bacterial load in the cecum by qPCR. (e) Alpha diversity indices (Shannon and Simpson). (f) PCoA based on the unweighted UniFrac analysis of operational taxonomic units (OTUs). (g) Anosim analysis on unweighted UniFrac distances in the fecal microbiota between the Sham and I/R mice. (h) Heatmap of the expression values of signaling pathways in each sample based on Tax4Fun analysis. The expression values of 16 samples are presented as the normalized z-score using the enrichment scores of signaling pathways. (i-j) Histogram of the LDA score showing the enriched bacteria and taxa in the gut microbiome of the I/R mice represented in the cladogram. (k-l) Scatter plots of PCA and OPLS-DA and S‐Plot analysis of metabolomics of cecal content. (m) Volcano plot showing the differentially accumulated [log2 (fold change) on X-axis] and significantly changed [-log10 (p) on Y-axis] metabolites in the Sham and I/R group. (n) CAT levels in cecum (nontargeted), (o) CAT levels after ABX treatment in cecum (P) CAT levels in cecum (targeted) from sham, I/R and I/R + CAT mice. The results are expressed as the mean ± SEM. n = 6–8. * p < .05, ** p < .01, *** p < .001 by one-way ANOVA (Tukey’s test)
